
System performance benchmarks
In this test, we installed the Geekbench 6.7.1 Preview, designed for RISC-V devices, to get a general estimate of the hardware performance running on Bianbu 4.0. You can check out our full detailed test report on the Geekbench website.
System Information & Test Results
| Specification | Value |
| Single-Core Score | 344 |
| Multi-Core Score | 1,679 |
| Device Name | SpacemiT K3 Pico ITX |
| Operating System | Bianbu 4.0 |
| Upload Date | May 23, 2026 10:39 AM |
| CPU Name | Spacemit® X100 |
| Topology | 1 Processor, 16 Cores |
| Base Frequency | 2.40 GHz |
| Instruction Sets | rvv, zvkb, zvkg, zvkned, zvfh |
| RAM Size | 15.60 GB |
| Geekbench Version | 6.7.1 Preview |
| Platform | Linux RISC-V |
Benchmark Breakdown
| Workload | Score | Throughput |
| File Compression | 304 | 43.7 MB/sec |
| Navigation | 692 | 4.17 routes/sec |
| HTML5 Browser | 382 | 7.82 pages/sec |
| PDF Renderer | 594 | 13.7 Mpixels/sec |
| Photo Library | 264 | 3.59 images/sec |
| Clang | 517 | 2.55 Klines/sec |
| Text Processing | 393 | 31.4 pages/sec |
| Asset Compression | 228 | 7.06 MB/sec |
| Object Detection | 163 | 4.88 images/sec |
| Background Blur | 310 | 1.28 images/sec |
| Horizon Detection | 613 | 19.1 Mpixels/sec |
| Object Remover | 212 | 16.3 Mpixels/sec |
| HDR | 359 | 10.5 Mpixels/sec |
| Photo Filter | 434 | 4.30 images/sec |
| Ray Tracer | 136 | 131.8 Kpixels/sec |
| Structure from Motion | 411 | 13.0 Kpixels/sec |
Multi-Core Workloads
| Workload | Score | Throughput |
| File Compression | 931 | 133.6 MB/sec |
| Navigation | 3,611 | 21.8 routes/sec |
| HTML5 Browser | 2,179 | 44.6 pages/sec |
| PDF Renderer | 3,698 | 85.3 Mpixels/sec |
| Photo Library | 1,624 | 22.0 images/sec |
| Clang | 3,208 | 15.8 Klines/sec |
| Text Processing | 472 | 37.8 pages/sec |
| Asset Compression | 1,674 | 51.9 MB/sec |
| Object Detection | 615 | 18.4 images/sec |
| Background Blur | 1,464 | 6.06 images/sec |
| Horizon Detection | 3,590 | 111.7 Mpixels/sec |
| Object Remover | 927 | 71.3 Mpixels/sec |
| HDR | 2,242 | 65.8 Mpixels/sec |
| Photo Filter | 2,212 | 21.9 images/sec |
| Ray Tracer | 1,064 | 1.03 Mpixels/sec |
| Structure from Motion | 2,732 | 86.5 Kpixels/sec |
K3 Pico ITX GeekBench Results
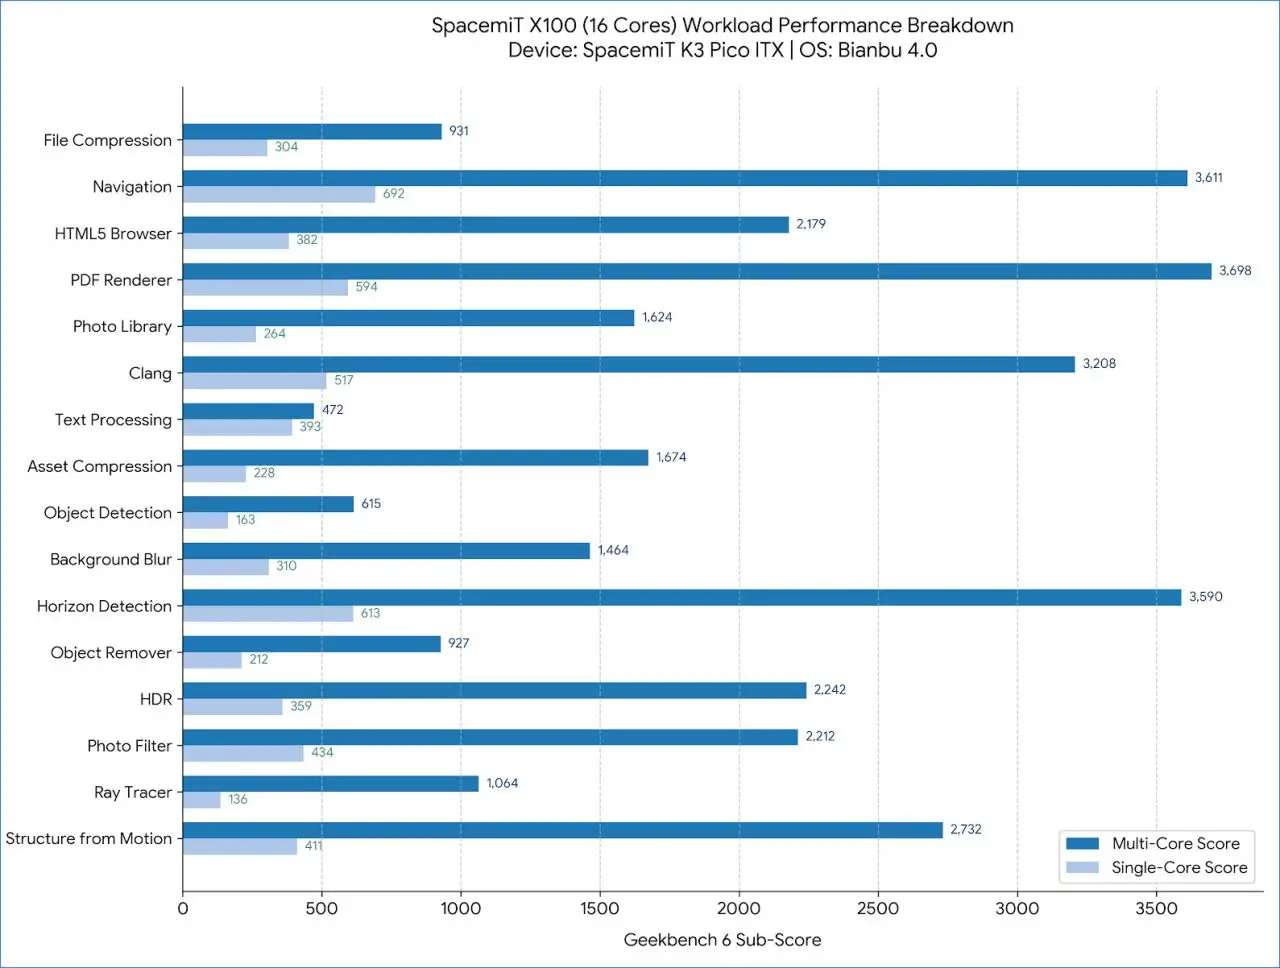
Key takeaways
- Multi-core scaling shows ~4.9x improvement over single-core, indicating good parallel workload efficiency across the 16 cores.
- Best performing single-core tasks: Navigation (692), Horizon Detection (613), PDF Renderer (594).
- Best performing multi-core tasks: PDF Renderer (3,698), Navigation (3,611), Horizon Detection (3,590).
Comparing the K3 Pico-ITX performance with other RISC-V boards
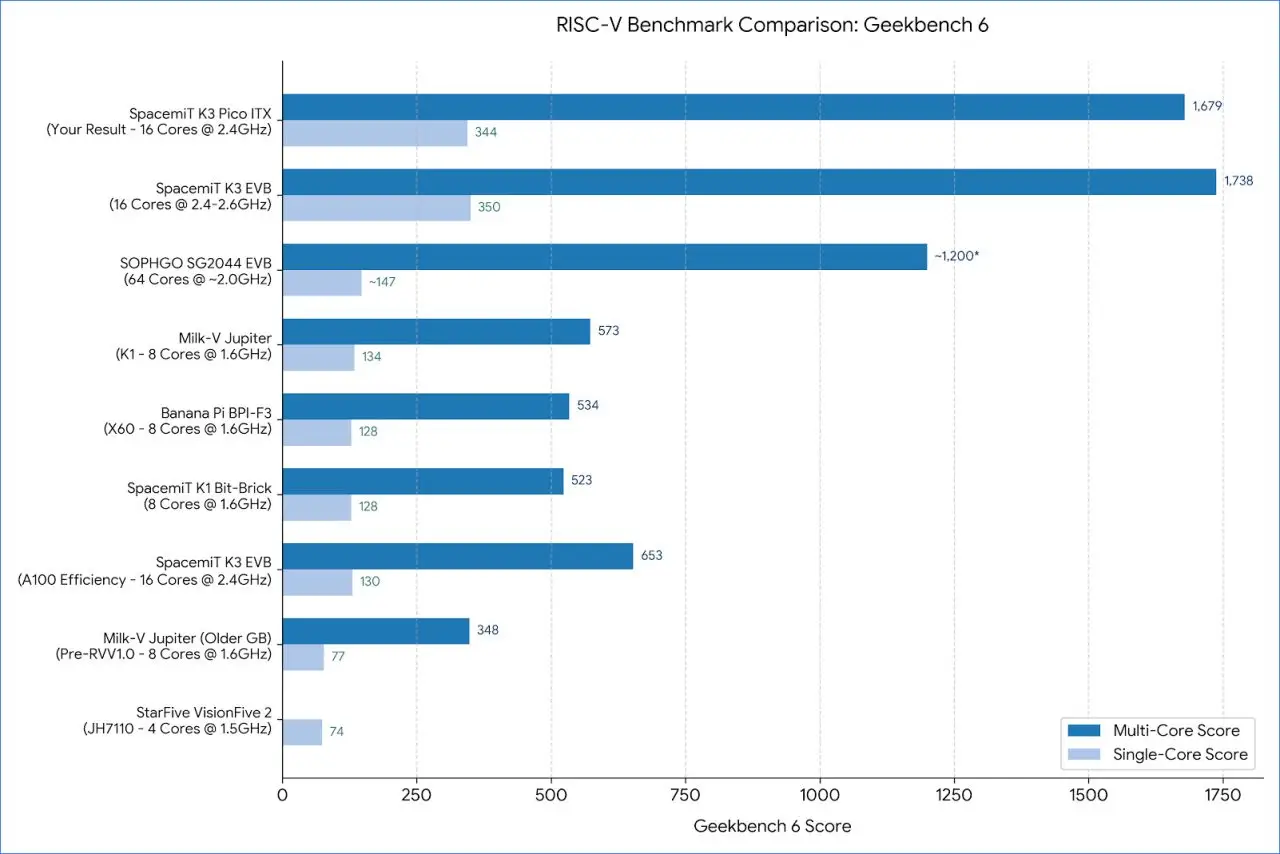
Key Takeaways
Our results show that the K3 ITX-Pico, a top-tier device, has claimed the number one spot, matching the performance of the evaluation board built on the same SpacemiT K3 RISC V SoC, known as the SpacemiT K3 EVB.


