
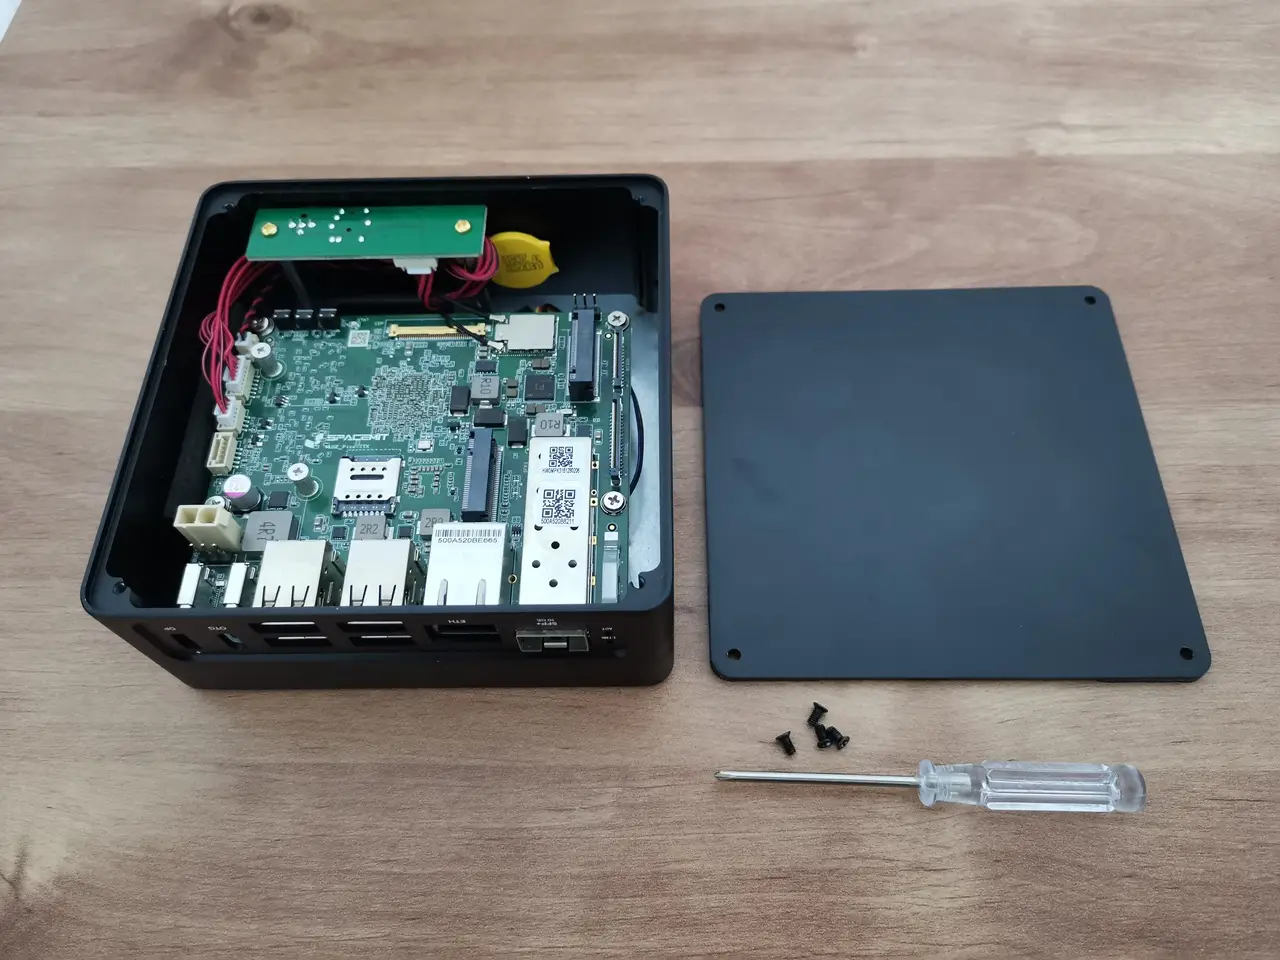
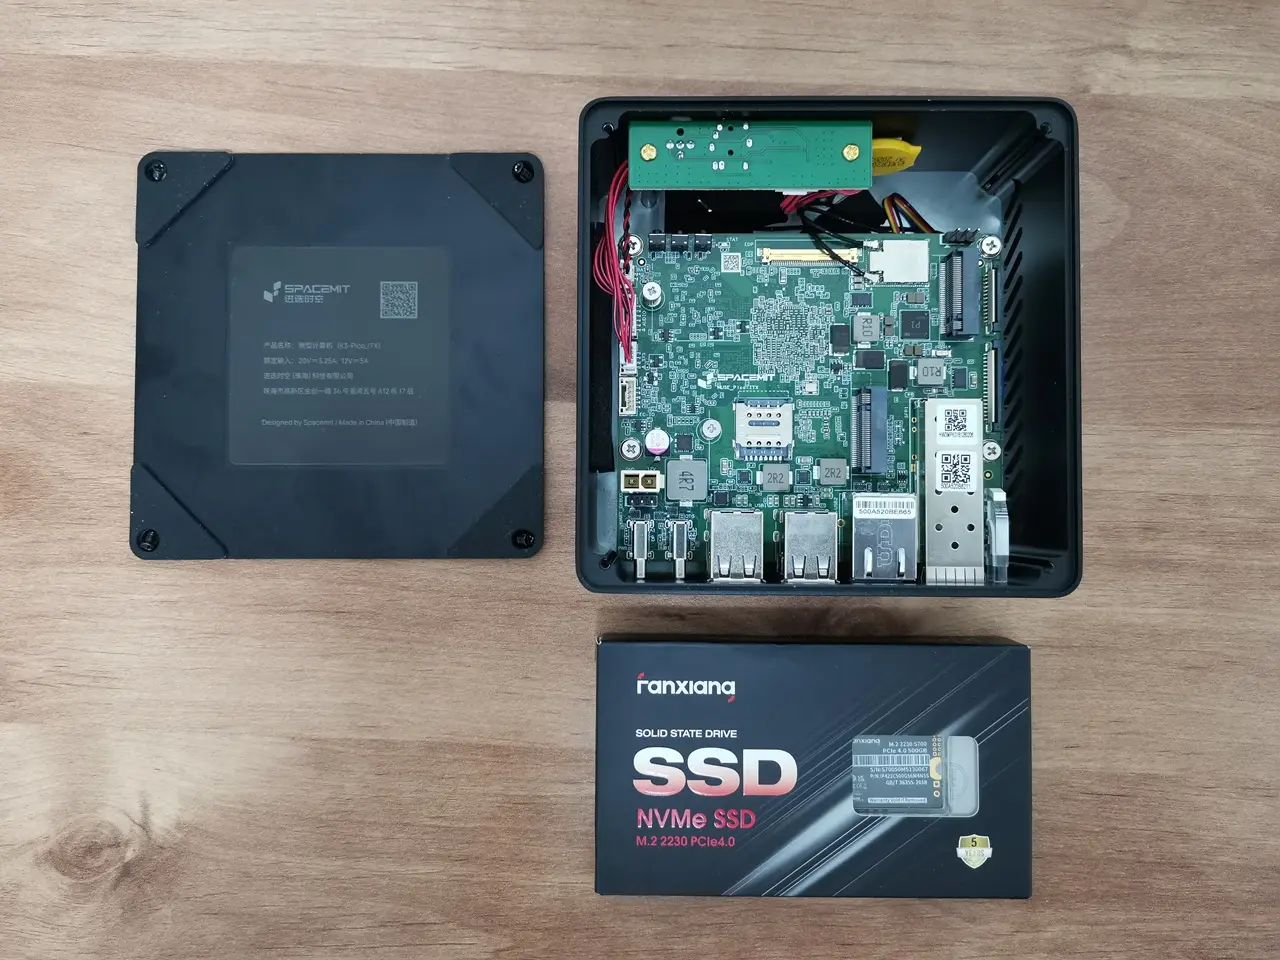
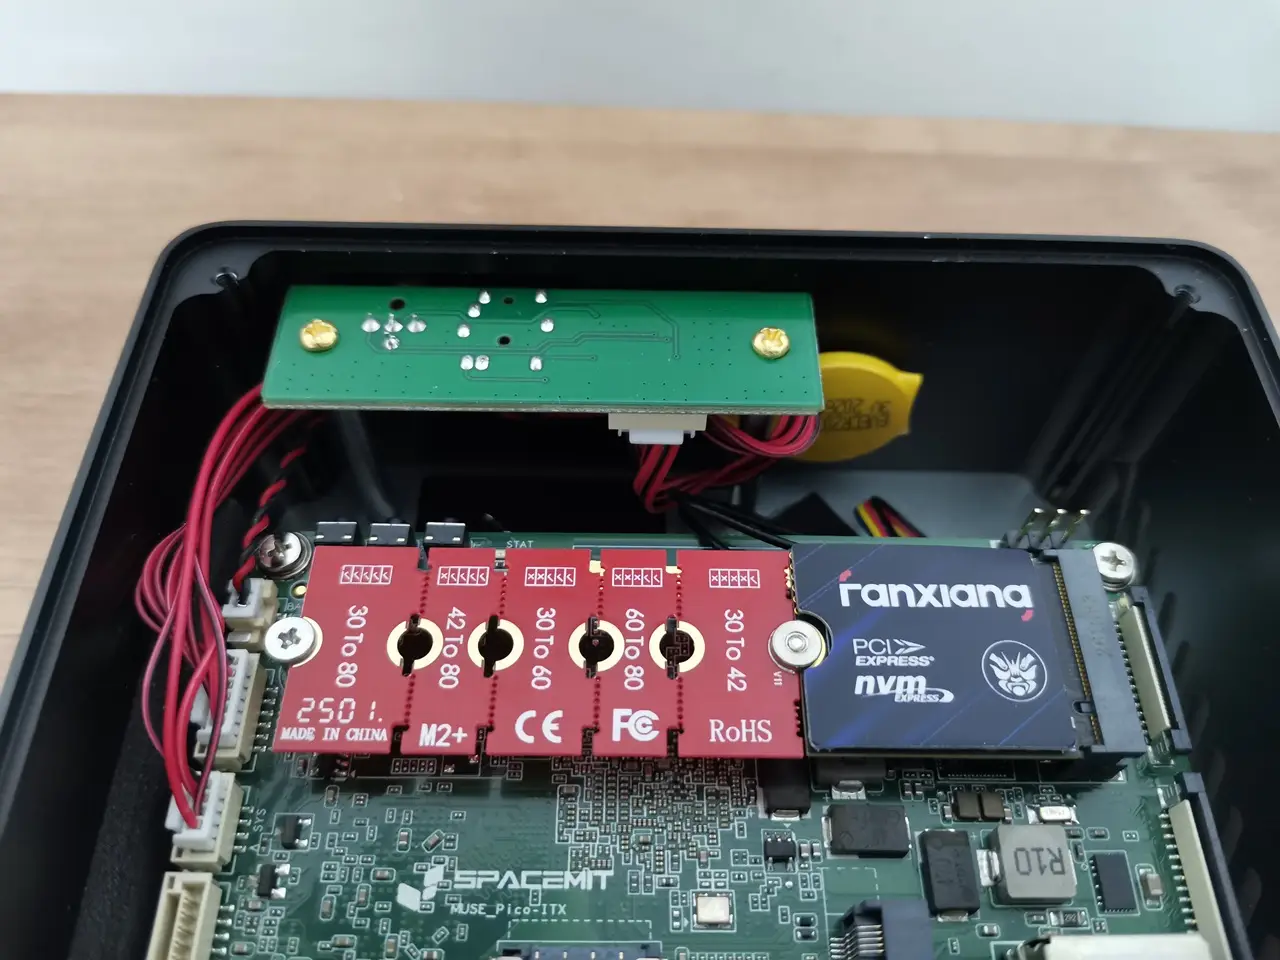
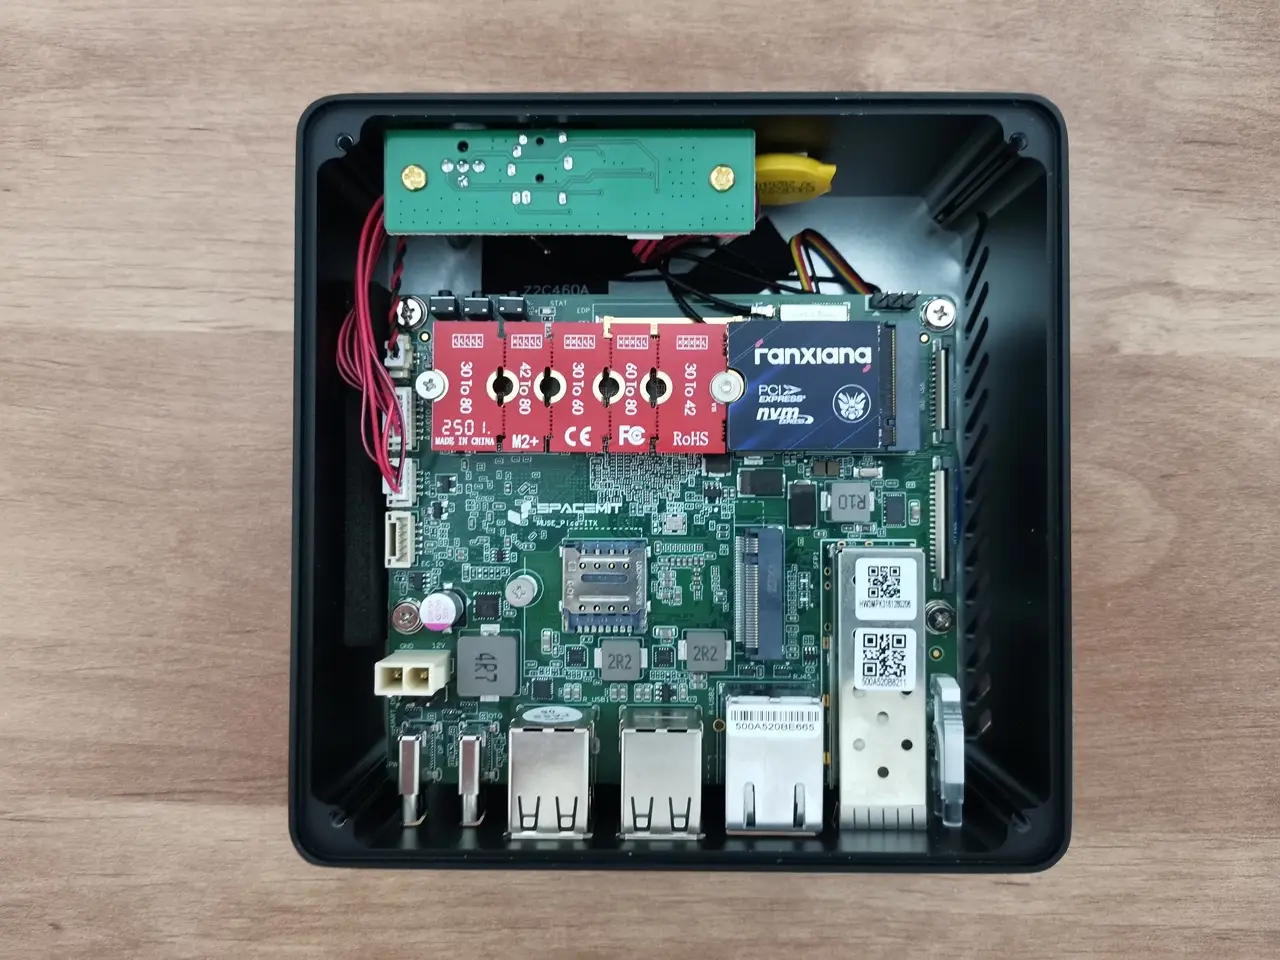
How to install an NVMe SSD
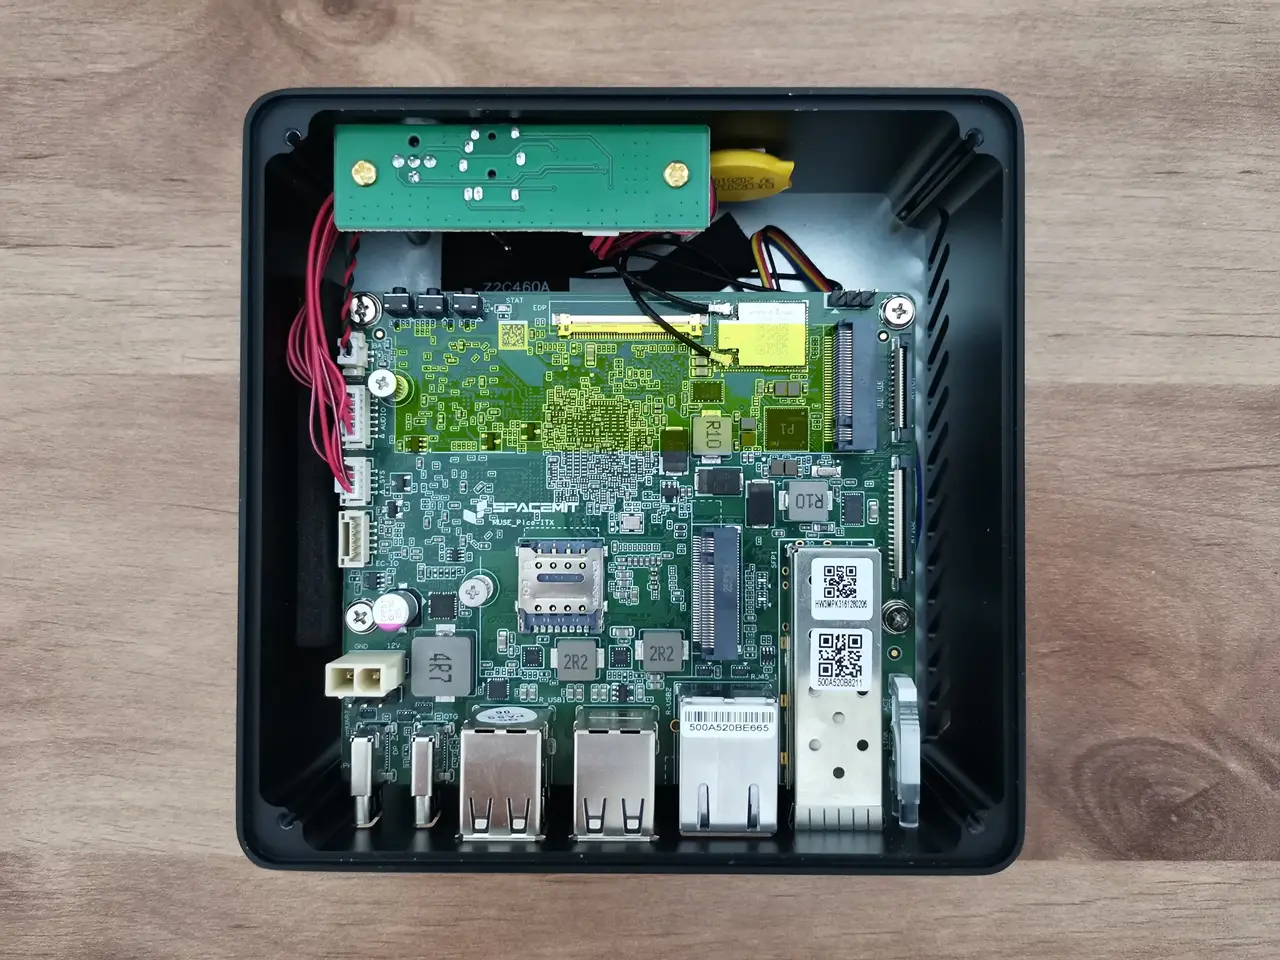
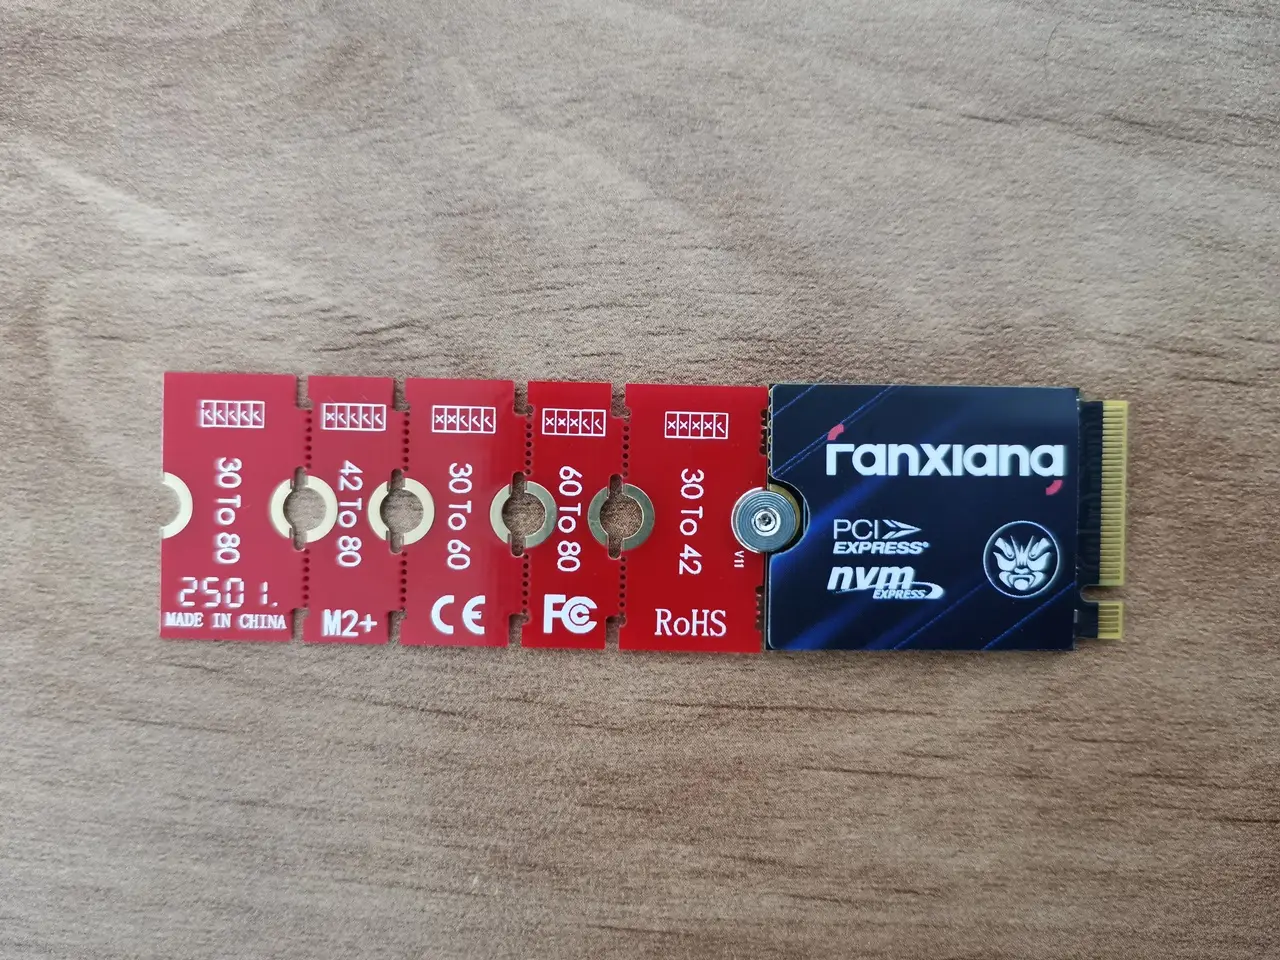
The K3 Pico-ITX Mini PC includes an M.2 Key M slot for a 2280 NVMe SSD, but if you have a shorter card like a 2230 or 2242, no problem—you can still use it with an M.2 NVMe SSD length extension adapter. For this test, we used our Fanxiang S700 500GB with an extension adapter.
| Spec | Fanxiang S700 500GB |
| Capacity | 500 GB |
| Form Factor | M.2 2230 |
| Interface | PCIe 4.0 ×4, NVMe protocol |
| Controller | Innogrit IG5220 |
| NAND Type | TLC NAND |
| Sequential Read | Up to 5000 MB/s |
| Sequential Write | Up to 4600 MB/s |
| Compatibility | Steam Deck, Surface Pro, laptops/desktops supporting 2230 NVMe |
| Use Case | Gaming, handhelds, compact PCs |
Checking for drives and partitions
In our setup, we installed a Fanxiang S700 500GB NVMe SSD, and Bianbu OS successfully recognized it as the device /dev/nvme0n.
Listing details of all available block devices, including hard drives, SSDs, and their partitions.
tzah@tzah-spacemit:/$ lsblk -o NAME,SIZE,TYPE,MOUNTPOINT
NAME        SIZE TYPE MOUNTPOINT
sda       119.3G disk
├─sda1      256M part /run/media/tzah/ESP
├─sda2      256M part /boot
└─sda3    118.8G part /
mtdblock0     8M disk
mtdblock1   128K disk
mtdblock2   512K disk
mtdblock3    64K disk
mtdblock4     1M disk
mtdblock5   384K disk
mtdblock6   5.9M disk
nvme0n1   465.8G disk <<< Our Fanxiang S700 500GB NVMe SSD
Performance benchmarks
⚡Fio benchmark with a 10 GB test file (sequential read/write): Testing the Fanxiang S700 NVMe
tzah@tzah-spacemit:/mnt/nvme$ sudo fio --name=seq --directory=/mnt/nvme --size=10G --bs=1M --rw=readwrite --ioengine=io_uring --iodepth=32 --numjobs=1 --time_based --runtime=20
seq: (g=0): rw=rw, bs=(R) 1024KiB-1024KiB, (W) 1024KiB-1024KiB, (T) 1024KiB-1024KiB, ioengine=io_uring, iodepth=32
fio-3.41
Starting 1 process
Jobs: 1 (f=1): [M(1)][100.0%][r=699MiB/s,w=698MiB/s][r=699,w=698 IOPS][eta 00m:00s]
seq: (groupid=0, jobs=1): err= 0: pid=1457151: Mon May 25 21:43:33 2026
read: IOPS=951, BW=951MiB/s (998MB/s)(18.6GiB/20010msec)
slat (usec): min=4, max=6776, avg=333.70, stdev=302.42
clat (nsec): min=250, max=1654.7M, avg=12924141.23, stdev=68796525.77
lat (usec): min=170, max=1654.8k, avg=13257.84, stdev=68805.99
clat percentiles (nsec):
| 1.00th=[ 334], 5.00th=[ 502], 10.00th=[ 708],
| 20.00th=[ 1256], 30.00th=[ 76288], 40.00th=[ 505856],
| 50.00th=[ 5013504], 60.00th=[ 8224768], 70.00th=[ 10027008],
| 80.00th=[ 11468800], 90.00th=[ 16449536], 95.00th=[ 66322432],
| 99.00th=[ 91750400], 99.50th=[ 102236160], 99.90th=[1652555776],
| 99.95th=[1652555776], 99.99th=[1652555776]
bw ( MiB/s): min= 302, max= 2144, per=100.00%, avg=1033.00, stdev=448.27, samples=36
iops : min= 302, max= 2144, avg=1033.00, stdev=448.27, samples=36
write: IOPS=952, BW=952MiB/s (999MB/s)(18.6GiB/20010msec); 0 zone resets
slat (usec): min=17, max=6209, avg=175.72, stdev=252.88
clat (usec): min=6, max=351109, avg=19037.78, stdev=28599.45
lat (usec): min=369, max=351150, avg=19213.49, stdev=28585.35
clat percentiles (usec):
| 1.00th=[ 1434], 5.00th=[ 6259], 10.00th=[ 8717], 20.00th=[ 10421],
| 30.00th=[ 11731], 40.00th=[ 13304], 50.00th=[ 14222], 60.00th=[ 14877],
| 70.00th=[ 15533], 80.00th=[ 16581], 90.00th=[ 20055], 95.00th=[ 41681],
| 99.00th=[191890], 99.50th=[210764], 99.90th=[350225], 99.95th=[350225],
| 99.99th=[350225]
bw ( MiB/s): min= 314, max= 2206, per=100.00%, avg=1032.94, stdev=449.46, samples=36
iops : min= 314, max= 2206, avg=1032.94, stdev=449.46, samples=36
lat (nsec) : 500=2.31%, 750=3.06%, 1000=2.54%
lat (usec) : 2=4.50%, 4=0.97%, 10=0.04%, 20=0.03%, 50=0.41%
lat (usec) : 100=1.59%, 250=2.17%, 500=2.44%, 750=0.95%, 1000=0.34%
lat (msec) : 2=1.44%, 4=2.74%, 10=17.81%, 20=47.10%, 50=3.89%
lat (msec) : 100=4.16%, 250=1.36%, 500=0.07%, 2000=0.08%
cpu : usr=8.03%, sys=52.80%, ctx=7428, majf=0, minf=17
IO depths : 1=0.1%, 2=0.1%, 4=0.1%, 8=0.1%, 16=0.1%, 32=99.9%, >=64=0.0%
submit : 0=0.0%, 4=100.0%, 8=0.0%, 16=0.0%, 32=0.0%, 64=0.0%, >=64=0.0%
complete : 0=0.0%, 4=100.0%, 8=0.0%, 16=0.0%, 32=0.1%, 64=0.0%, >=64=0.0%
issued rwts: total=19037,19055,0,0 short=0,0,0,0 dropped=0,0,0,0
latency : target=0, window=0, percentile=100.00%, depth=32
Run status group 0 (all jobs):
READ: bw=951MiB/s (998MB/s), 951MiB/s-951MiB/s (998MB/s-998MB/s), io=18.6GiB (20.0GB), run=20010-20010msec
WRITE: bw=952MiB/s (999MB/s), 952MiB/s-952MiB/s (999MB/s-999MB/s), io=18.6GiB (20.0GB), run=20010-20010msec
Disk stats (read/write):
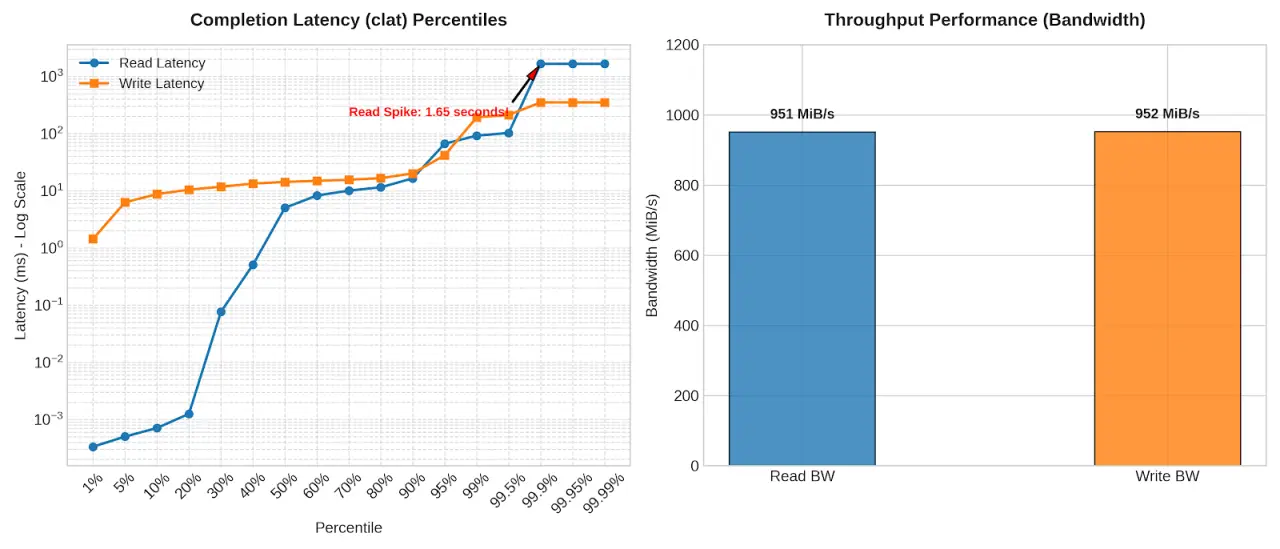
nvme0n1: ios=42738/71067, sectors=21881856/36282440, merge=0/4, ticks=154469/2725114, in_queue=2879614, util=65.54%Full Benchmark Summary — 10 GB Sequential Read/Write Test
| Performance Metric | Run 1: psync (QD=1) | Run 2: io_uring (QD=32) |
| Read Throughput | 1,015 MiB/s | 951 MiB/s |
| Write Throughput | 1,017 MiB/s | 952 MiB/s |
| Read IOPS | 1,015 | 951 |
| Write IOPS | 1,016 | 952 |
| Avg. Read Latency | 0.52 ms | 12.92 ms |
| Avg. Write Latency | 0.39 ms | 19.04 ms |
| Max Read Latency | 110.24 ms | 1,654.70 ms |
| Max Write Latency | 44.73 ms | 351.11 ms |
| 99th %ile Read Latency | 2.57 ms | 91.75 ms |
| 99th %ile Write Latency | 3.36 ms | 191.89 ms |
| CPU User Usage | 2.91% | 8.03% |
| CPU System Usage | 69.50% | 52.80% |
| Drive Utilization | 57.71% | 65.54% |
Fanxiang S700 NVMe fio benchmark results on the K3 Pico ITX.
⚡Fio Sequential Write Speed Test: Writing (creating) a 10 GB file on our UFS
tzah@home-spacemit:~$ fio --name=write --filename=ssdtest --rw=write --bs=1M --size=10G --iodepth=16
write: (g=0): rw=write, bs=(R) 1024KiB-1024KiB, (W) 1024KiB-1024KiB, (T) 1024KiB-1024KiB, ioengine=psync, iodepth=16
fio-3.41
Starting 1 process
note: both iodepth >= 1 and synchronous I/O engine are selected, queue depth will be capped at 1
Jobs: 1 (f=1): [W(1)][98.3%][eta 00m:01s]
write: (groupid=0, jobs=1): err= 0: pid=268204: Wed May 20 15:09:49 2026
  write: IOPS=175, BW=176MiB/s (184MB/s)(10.0GiB/58310msec); 0 zone resets
    clat (usec): min=252, max=4590.4k, avg=5678.33, stdev=120813.39
     lat (usec): min=264, max=4590.4k, avg=5692.21, stdev=120813.35
    clat percentiles (usec):
     |  1.00th=[    277],  5.00th=[    281], 10.00th=[    281],
     | 20.00th=[    285], 30.00th=[    285], 40.00th=[    289],
     | 50.00th=[    293], 60.00th=[    297], 70.00th=[    306],
     | 80.00th=[    420], 90.00th=[  11207], 95.00th=[  11338],
     | 99.00th=[  15664], 99.50th=[  23200], 99.90th=[2432697],
     | 99.95th=[3506439], 99.99th=[4462740]
   bw (  KiB/s): min= 2048, max=2125824, per=100.00%, avg=420508.73, stdev=462855.44, samples=49
   iops        : min=    2, max= 2076, avg=410.65, stdev=452.01, samples=49
  lat (usec)   : 500=86.68%, 750=0.33%, 1000=0.48%
  lat (msec)   : 2=0.35%, 4=0.04%, 10=0.10%, 20=11.25%, 50=0.66%
  lat (msec)   : >=2000=0.11%
  cpu          : usr=0.21%, sys=5.66%, ctx=1277, majf=0, minf=12
  IO depths    : 1=100.0%, 2=0.0%, 4=0.0%, 8=0.0%, 16=0.0%, 32=0.0%, >=64=0.0%
     submit    : 0=0.0%, 4=100.0%, 8=0.0%, 16=0.0%, 32=0.0%, 64=0.0%, >=64=0.0%
     complete  : 0=0.0%, 4=100.0%, 8=0.0%, 16=0.0%, 32=0.0%, 64=0.0%, >=64=0.0%
     issued rwts: total=0,10240,0,0 short=0,0,0,0 dropped=0,0,0,0
     latency   : target=0, window=0, percentile=100.00%, depth=16

Run status group 0 (all jobs):
  WRITE: bw=176MiB/s (184MB/s), 176MiB/s-176MiB/s (184MB/s-184MB/s), io=10.0GiB (10.7GB), run=58310-58310msec

Disk stats (read/write):
  sda: ios=9/9560, sectors=392/19491360, merge=29/18, ticks=333/3442620, in_queue=3442991, util=97.91%
Full Benchmark Summary (10 GB Sequential Write Test)
| Metric | Result |
| Test Type | Sequential Write |
| Block Size | 1 MiB |
| Total Test Size | 10 GiB |
| I/O Engine | psync (synchronous) |
| Queue Depth | 1 (capped) |
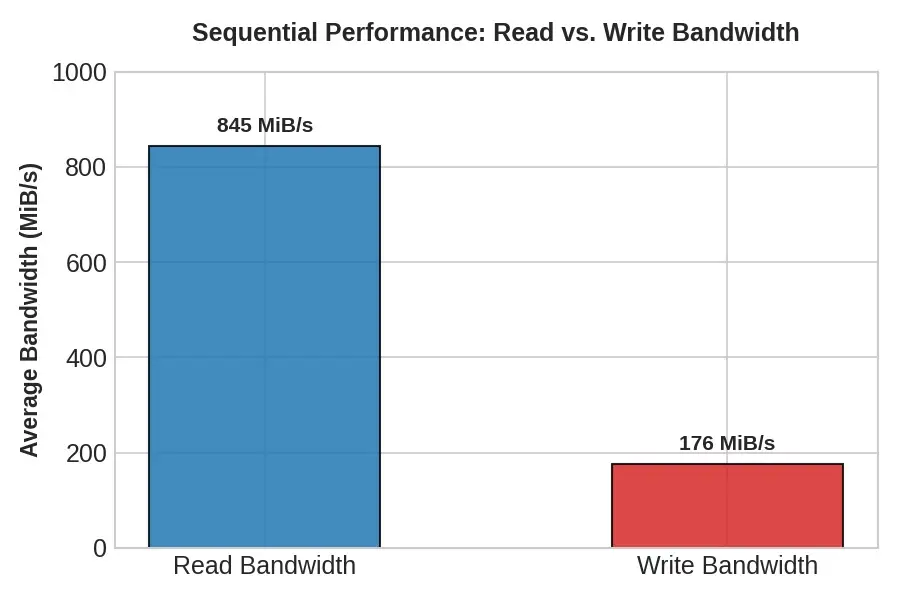
| Average Bandwidth | 176 MiB/s (184 MB/s) |
| IOPS | 175 |
| Total Time | 58.3 s |
| Average Latency | 5.68 ms |
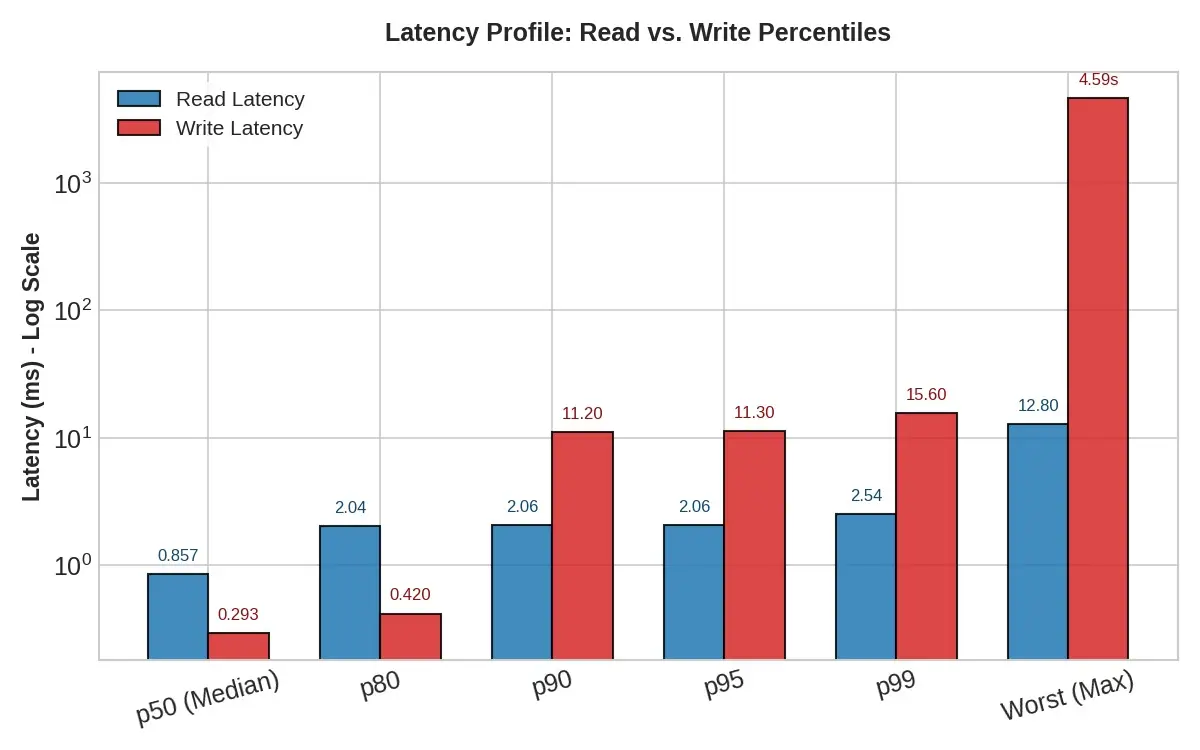
| Median Latency (p50) | 0.293 ms |
| p80 Latency | 0.420 ms |
| p90 Latency | 11.2 ms |
| p95 Latency | 11.3 ms |
| p99 Latency | 15.6 ms |
| Worst Latency (max) | 4.59 s |
| Disk Utilization | 97.9% |
| Total Writes Completed | 10 GiB |
| Device Tested | /dev/sda3 (TY7B128 SSD) |
⚡Fio Sequential Read Speed Test: Reading a 10 GB file on our UFS
tzah@home-spacemit:~$ fio --name=read --filename=ssdtest --rw=read --bs=1M --size=10G --iodepth=16
read: (g=0): rw=read, bs=(R) 1024KiB-1024KiB, (W) 1024KiB-1024KiB, (T) 1024KiB-1024KiB, ioengine=psync, iodepth=16
fio-3.41
Starting 1 process
note: both iodepth >= 1 and synchronous I/O engine are selected, queue depth will be capped at 1
Jobs: 1 (f=1): [R(1)][100.0%][r=871MiB/s][r=870 IOPS][eta 00m:00s]
read: (groupid=0, jobs=1): err= 0: pid=269981: Wed May 20 15:12:12 2026
  read: IOPS=845, BW=845MiB/s (886MB/s)(10.0GiB/12114msec)
    clat (usec): min=170, max=12842, avg=1130.56, stdev=977.49
     lat (usec): min=171, max=12842, avg=1130.79, stdev=977.40
    clat percentiles (usec):
     |  1.00th=[  176],  5.00th=[  178], 10.00th=[  178], 20.00th=[  180],
     | 30.00th=[  188], 40.00th=[  190], 50.00th=[  857], 60.00th=[ 2024],
     | 70.00th=[ 2040], 80.00th=[ 2040], 90.00th=[ 2057], 95.00th=[ 2057],
     | 99.00th=[ 2540], 99.50th=[ 3392], 99.90th=[ 6063], 99.95th=[ 6718],
     | 99.99th=[ 9241]
   bw (  KiB/s): min=868352, max=921600, per=100.00%, avg=903257.04, stdev=16167.04, samples=23
   iops        : min=  848, max=  900, avg=882.09, stdev=15.79, samples=23
  lat (usec)   : 250=49.78%, 500=0.21%, 1000=0.01%
  lat (msec)   : 2=2.64%, 4=47.05%, 10=0.30%, 20=0.01%
  cpu          : usr=0.19%, sys=27.98%, ctx=5140, majf=0, minf=266
  IO depths    : 1=100.0%, 2=0.0%, 4=0.0%, 8=0.0%, 16=0.0%, 32=0.0%, >=64=0.0%
     submit    : 0=0.0%, 4=100.0%, 8=0.0%, 16=0.0%, 32=0.0%, 64=0.0%, >=64=0.0%
     complete  : 0=0.0%, 4=100.0%, 8=0.0%, 16=0.0%, 32=0.0%, 64=0.0%, >=64=0.0%
     issued rwts: total=10240,0,0,0 short=0,0,0,0 dropped=0,0,0,0
     latency   : target=0, window=0, percentile=100.00%, depth=16

Run status group 0 (all jobs):
   READ: bw=845MiB/s (886MB/s), 845MiB/s-845MiB/s (886MB/s-886MB/s), io=10.0GiB (10.7GB), run=12114-12114msec

Disk stats (read/write):
  sda: ios=10026/2, sectors=20529152/48, merge=0/4, ticks=34204/53, in_queue=34260, util=71.09%
Full Benchmark Summary — 10 GB Sequential READ Test
| Metric | Result |
| Test Type | Sequential Read |
| Block Size | 1 MiB |
| Total Test Size | 10 GiB |
| I/O Engine | psync (synchronous) |
| Queue Depth | 1 (capped) |
| Average Bandwidth | 845 MiB/s (886 MB/s) |
| IOPS | 845 |
| Total Time | 12.1 s |
| Average Latency | 1.13 ms |
| Median Latency (p50) | 0.857 ms |
| p80 Latency | 2.04 ms |
| p90 Latency | 2.06 ms |
| p95 Latency | 2.06 ms |
| p99 Latency | 2.54 ms |
| Worst Latency (max) | 12.8 ms |
| Disk Utilization | 71.1% |
| Total Reads Completed | 10 GiB |
| Device Tested | /dev/sda3 (TY7B128 SSD) |
What do p80, p90, p95, and p99 latency mean?
These are latency percentiles — they tell you how long I/O operations take at different points in the distribution.
Think of them as “how fast the SSD responds for X% of operations”.
| Percentile | Meaning |
| p80 latency | 80% of all read operations were faster than 2.04 ms |
| p90 latency | 90% of reads were faster than 2.06 ms |
| p95 latency | 95% of reads were faster than 2.06 ms |
| p99 latency | 99% of reads were faster than 2.54 ms |
Test Results In plain language:
- The UFS is quite reliable.
- 99% of reads complete in under 3 ms
- Only 1% are slower (due to caching, garbage collection, controller behavior).
- Stable Reads: Conversely, the read latency is rock-solid. Even its absolute worst-case scenario is just 12.8 ms, ensuring quick response times when retrieving files.
- The performance is quite impressive for a 128 GB embedded storage.


