
Connectivity
Wireless connectivity
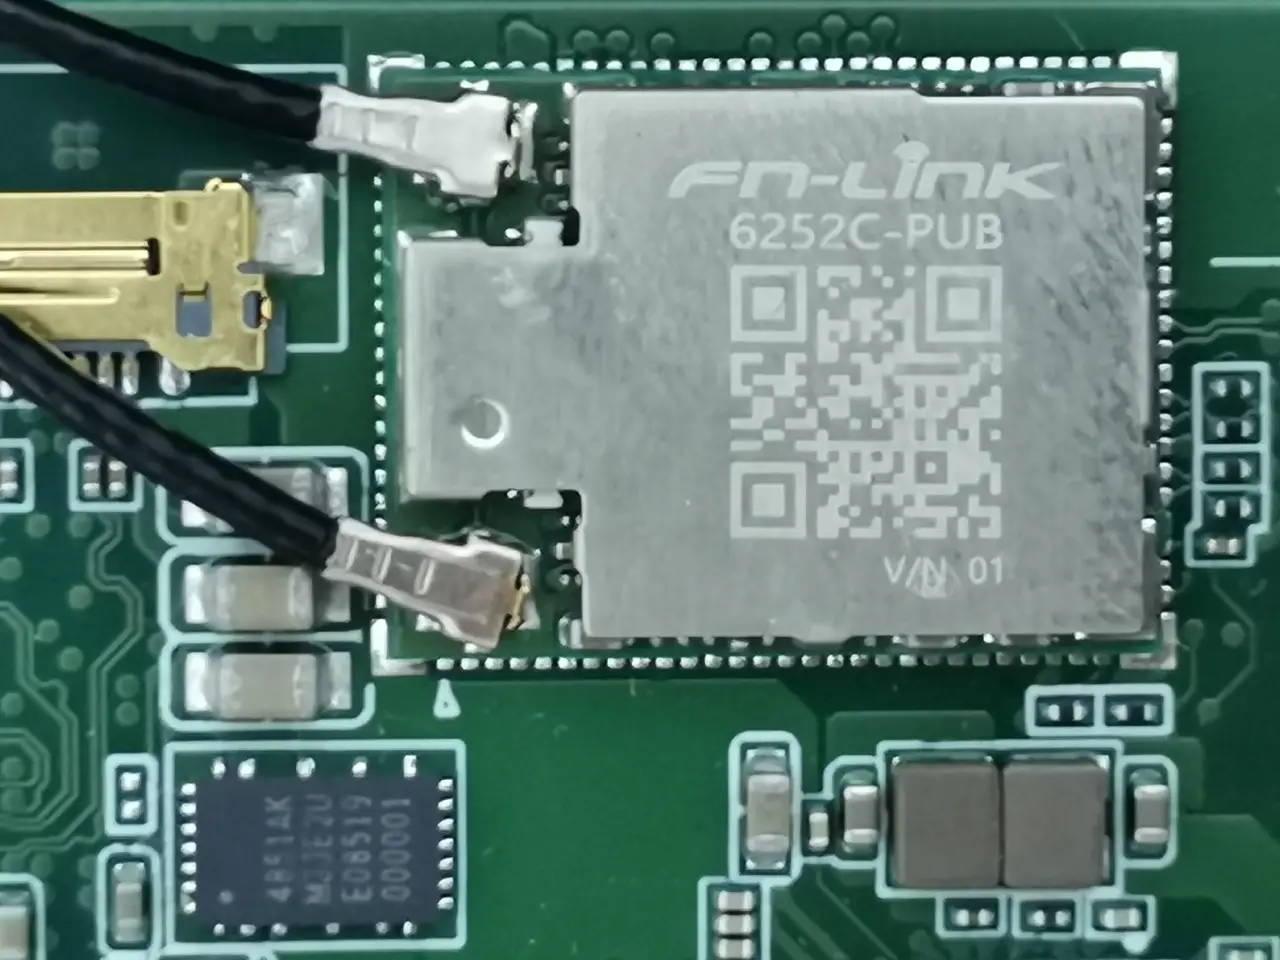
For wireless connectivity, the K3 Pico ITX board comes with built-in Wi-Fi powered by the Fn-Link 6252C-PUB chip, which is based on the RTL8852BE design. If you’re curious about the exact specs, we’ve also included a table from the manufacturer below.
| Feature | Description |
| Data Rate (Max) | 1200Mbps |
| WLAN Standards | IEEE 802.11a/b/g/n/ac/ax compatible |
| Channel Support | 20/40 MHz @ 2.4 GHz; 20/40/80 MHz @ 5 GHz |
| 802.11ac 2×2 | Wave2 compliant with RX MUMIMO |
| 802.11n MIMO | Full MIMO solution for 2.4 GHz & 5 GHz bands |
| Coexistence Control | Enhanced BT/WiFi coexistence for improved transmission quality |
| Power Management | Integrated 32 kHz oscillator |
| Host Interface | Lowpower PCIe 1.1 for WLAN + USB 2.0 FSmode for Bluetooth |
| Bluetooth Version | Supports Bluetooth 5.2 |
| BT Compatibility | Compatible with Bluetooth v2.1+EDR |
| Dual Mode | Simultaneous LE + BR/EDR |
| BT Power Classes | Supports Class 1, 2, and 3 without external PA |
How is the performance?
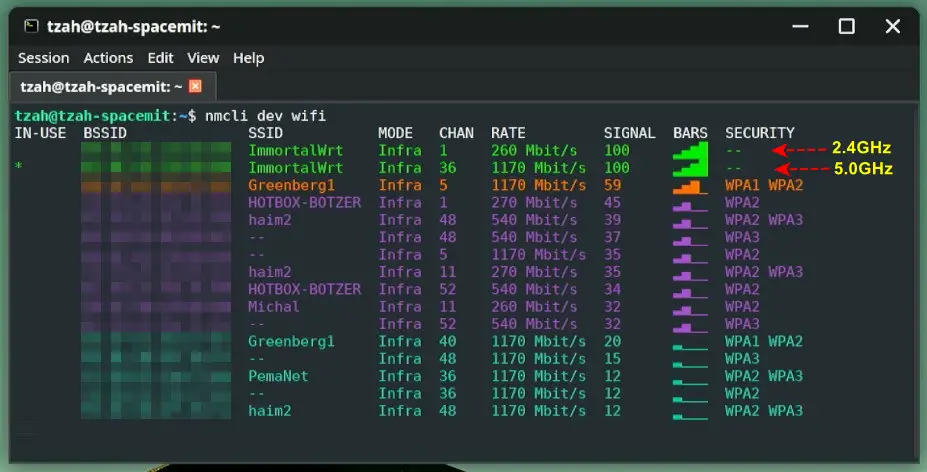
In our experience, it was decent but nothing extraordinary. We reached a connection speed of around 1170 Mbps in the 5GHz band with our Banana Pi BPI-R3 router, which supports Wi-Fi 6, during a test conducted very close at distance of about 2 meters.
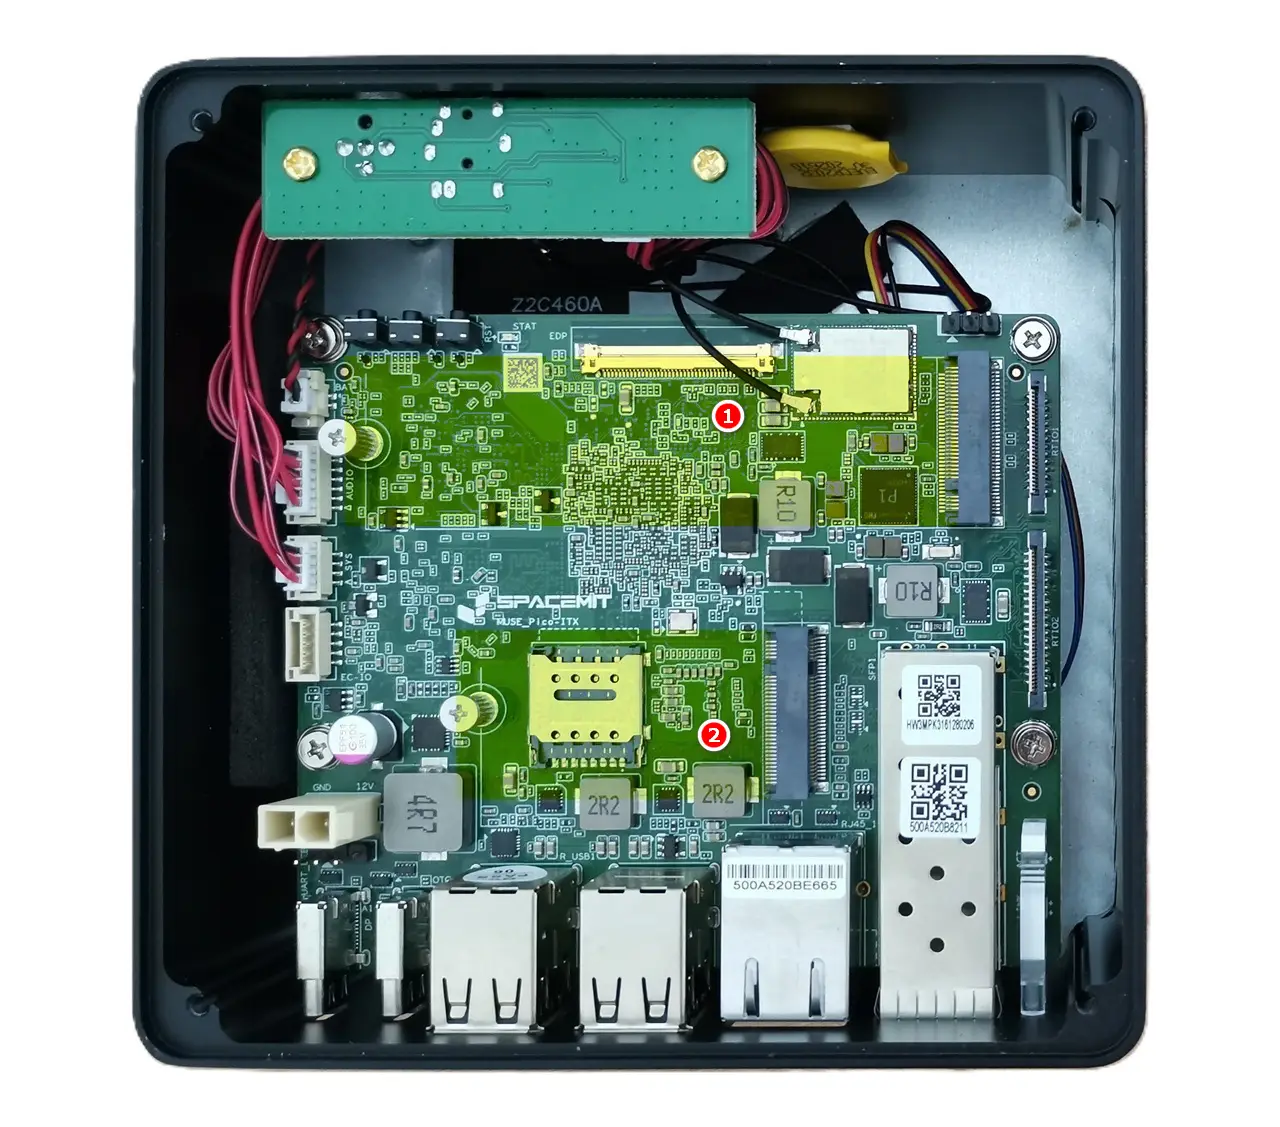
Additionally, SpacemiT, for some reason, opted to use internal wired antennas with a PCB glued to the upper part of the metal case, which could potentially block signal reception when enclosed in a sealed metal casing (Faraday cage effect). Using external Wi-Fi antennas might be a better option, but overall, everything seems to be working just fine.
We nearly reached the theoretical 1200 Mbps link speed of our Wi-Fi chip, with the 5 GHz band running on channel 36 and the 2.4 GHz band on channel 1.
What about support for cellular modems?
If the onboard Wi-Fi doesn’t cut it, this board also features a Key-B M.2 slot and a Nano SIM card slot for adding a compatible 4G LTE or 5G cellular modem. Pro tip: for long-term use, go for a card that’s OpenWrt-compatible. Company sources say official mainline support is coming soon, making it possible to use this device as an access point or mini router.
K3 Pico ITX (Available M.2 Slots)
| Item No. | Description | Purposes |
| 1 | M.2 M-Key Supports 2280 NVMe SSDs. | High-speed NVMe SSD |
| 2 | M.2 B-Key Supports 2242/3042 cards. | 4G LTE or 5G Cellular Modem |
Setting up our 10Gb RJ45 SFP+ module
iPerf3 network throughput Speed Test
Verifying whether the SFP+ port (cage) truly supports 10Gbps speeds.
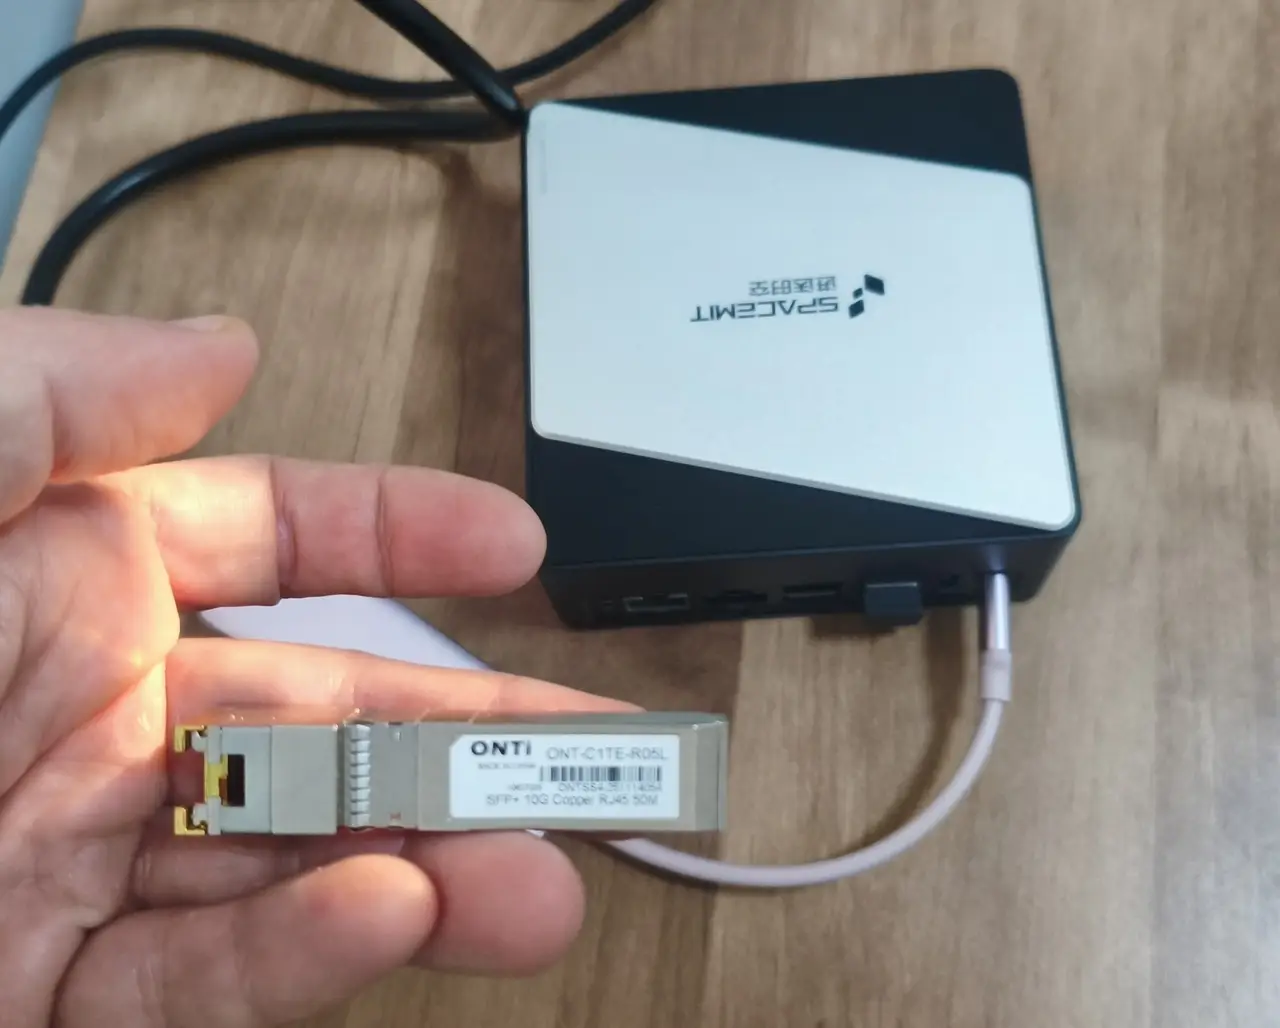
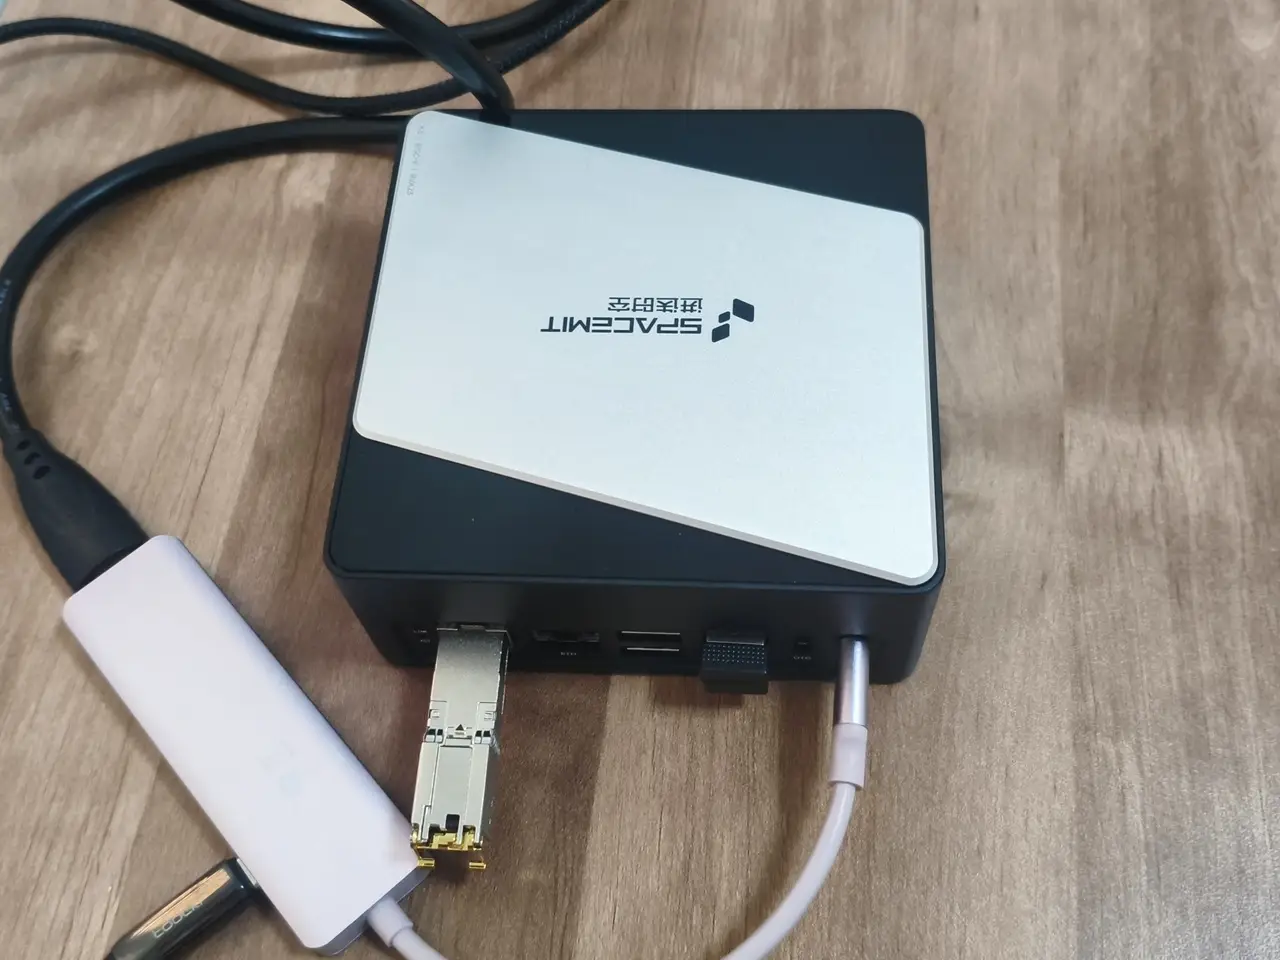
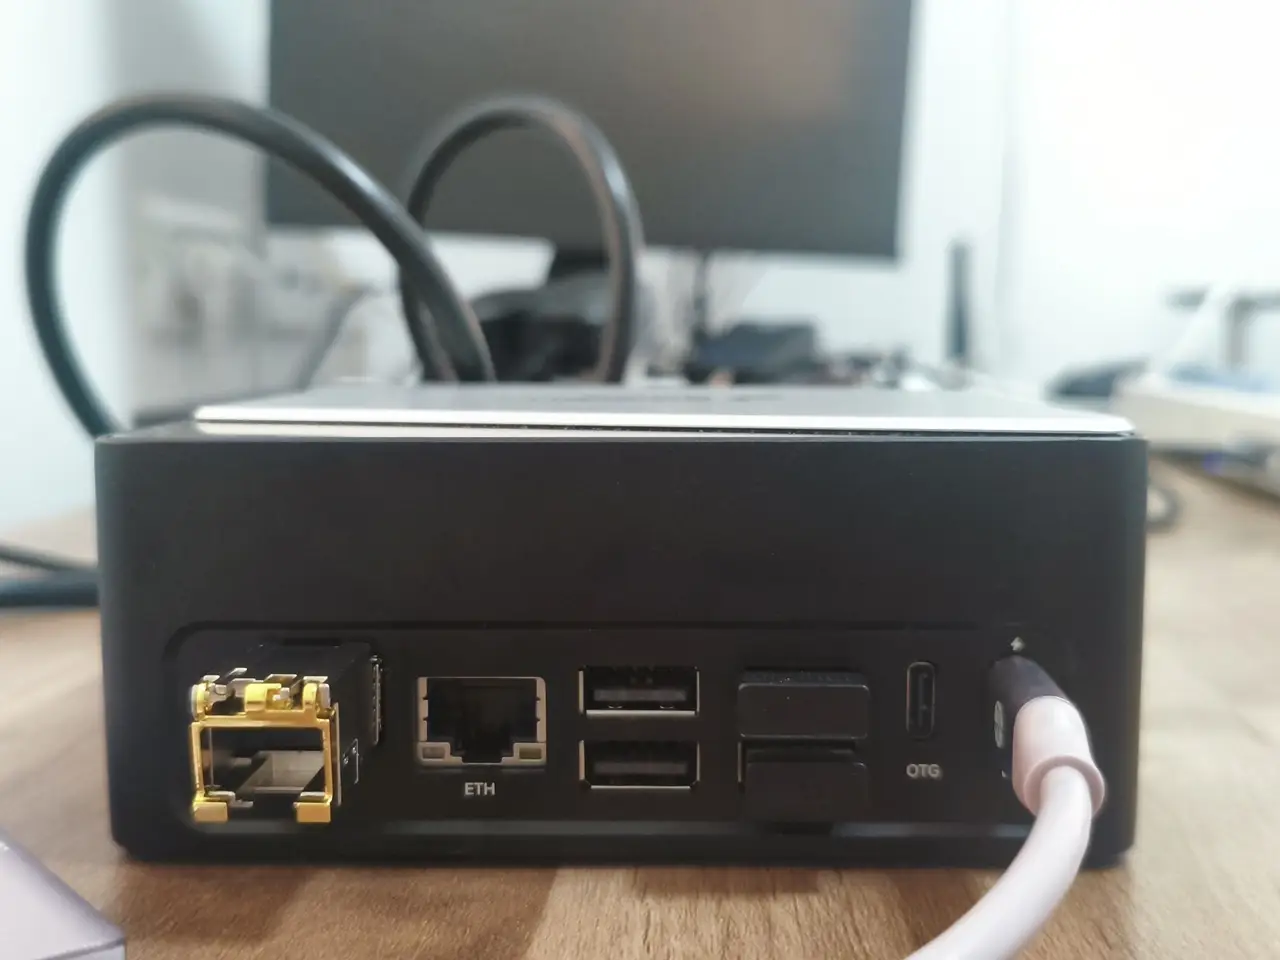
The Pico-ITX comes with two ports: a 1Gb RJ45 Ethernet LAN port and a cage for an optical SFP+ module. To test its speed, we hooked up an ONTi SFP+ to RJ45 adapter to the Mini PC and used a Cat8 Ethernet cable to connect it directly to a Windows 11 desktop with a Marvell AQtion 10Gbit Network Adapter. In this setup, we ran iperf3 on both machines, with the Mini PC as the server and the desktop PC as our end client device.
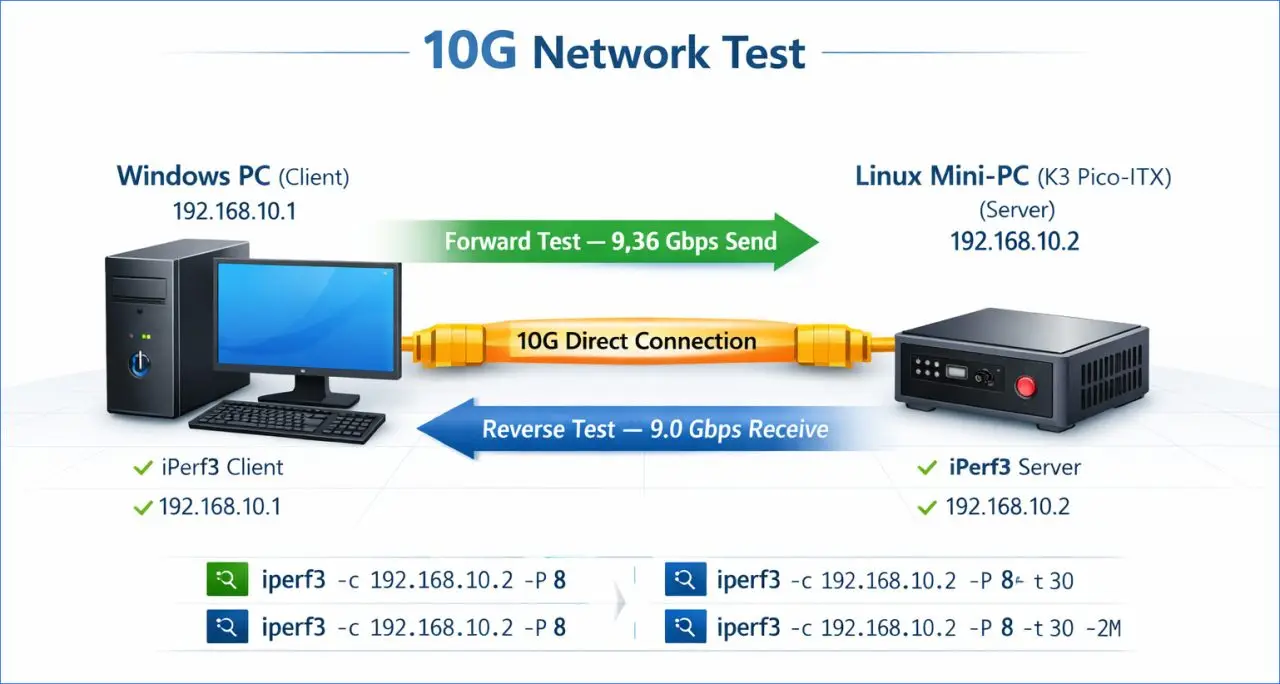
| Device No. | Device Name | IP Address | Description | Command |
| 1 | Desktop PC (Client) | 192.168.10.1 (Static IP) | Reverse direction (Linux → Windows) Forward direction (Windows → Linux) | iperf3 -c 192.168.10.2 -P 8 -t 30 -w 2M -R iperf3 -c 192.168.10.2 -P 8 -t 30 -w 2M |
| 2 | Pico-ITX Mini PC (Server) | 192.168.10.2 (Static IP) | – | iperf3 -s |
Forward direction Test: (Desktop PC→ K3 Pico-ITX Mini PC)
Description: This command pushes the maximum data to 192.168.10.2 using 8 parallel streams for 30 seconds with a large TCP window, aiming to measure the link’s actual peak throughput.
C:\Temp>iperf3 -c 192.168.10.2 -P 8 -t 30 -w 2M
Connecting to host 192.168.10.2, port 5201
[ ID] Interval Transfer Bandwidth
[ 4] 0.00-30.00 sec 4.10 GBytes 1.17 Gbits/sec sender
[ 4] 0.00-30.00 sec 4.10 GBytes 1.17 Gbits/sec receiver
[ 6] 0.00-30.00 sec 4.10 GBytes 1.17 Gbits/sec sender
[ 6] 0.00-30.00 sec 4.10 GBytes 1.17 Gbits/sec receiver
[ 8] 0.00-30.00 sec 4.09 GBytes 1.17 Gbits/sec sender
[ 8] 0.00-30.00 sec 4.09 GBytes 1.17 Gbits/sec receiver
[ 10] 0.00-30.00 sec 4.09 GBytes 1.17 Gbits/sec sender
[ 10] 0.00-30.00 sec 4.09 GBytes 1.17 Gbits/sec receiver
[ 12] 0.00-30.00 sec 4.09 GBytes 1.17 Gbits/sec sender
[ 12] 0.00-30.00 sec 4.09 GBytes 1.17 Gbits/sec receiver
[ 14] 0.00-30.00 sec 4.09 GBytes 1.17 Gbits/sec sender
[ 14] 0.00-30.00 sec 4.09 GBytes 1.17 Gbits/sec receiver
[ 16] 0.00-30.00 sec 4.07 GBytes 1.17 Gbits/sec sender
[ 16] 0.00-30.00 sec 4.07 GBytes 1.17 Gbits/sec receiver
[ 18] 0.00-30.00 sec 4.07 GBytes 1.17 Gbits/sec sender
[ 18] 0.00-30.00 sec 4.07 GBytes 1.17 Gbits/sec receiver
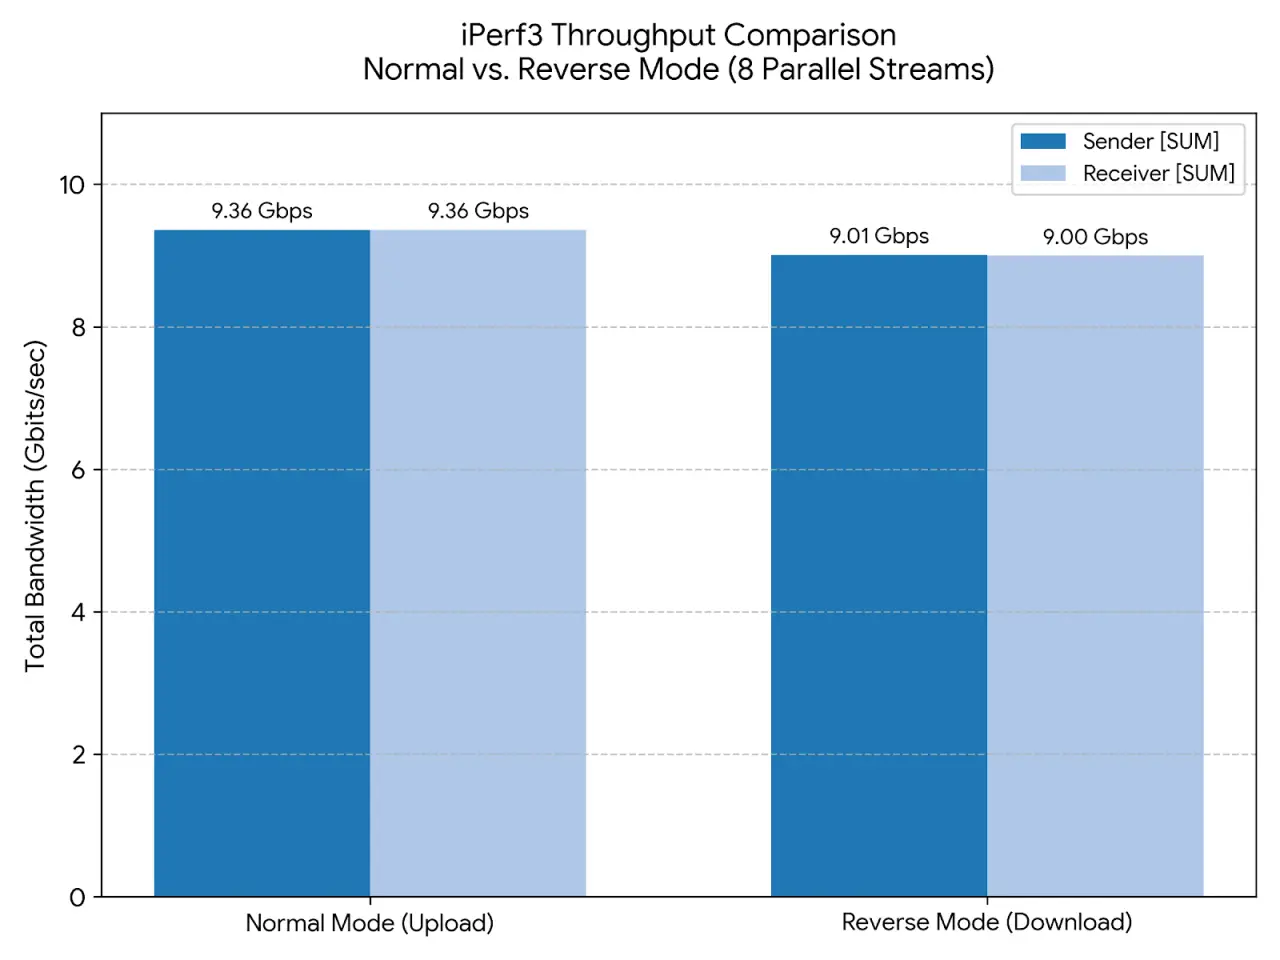
[SUM] 0.00-30.00 sec 32.7 GBytes 9.36 Gbits/sec sender
[SUM] 0.00-30.00 sec 32.7 GBytes 9.36 Gbits/sec receiverReverse direction Test: (K3 Pico-ITX Mini PC → Desktop PC)
Description: This command connects to 192.168.10.2 and runs a 30second, 8stream, highspeed test, sending the traffic from the server back to the client.
C:\Temp>iperf3 -c 192.168.10.2 -P 8 -t 30 -w 2M -R
Connecting to host 192.168.10.2, port 5201
Reverse mode, remote host 192.168.10.2 is sending

 ID] Interval           Transfer     Bandwidth       Retr
[  4]   0.00-30.00  sec  3.93 GBytes  1.13 Gbits/sec  1023             sender
[  4]   0.00-30.00  sec  3.93 GBytes  1.12 Gbits/sec                  receiver
[  6]   0.00-30.00  sec  3.94 GBytes  1.13 Gbits/sec  791             sender
[  6]   0.00-30.00  sec  3.93 GBytes  1.12 Gbits/sec                  receiver
[  8]   0.00-30.00  sec  3.93 GBytes  1.13 Gbits/sec    0             sender
[  8]   0.00-30.00  sec  3.93 GBytes  1.12 Gbits/sec                  receiver
[ 10]   0.00-30.00  sec  3.93 GBytes  1.13 Gbits/sec  288             sender
[ 10]   0.00-30.00  sec  3.93 GBytes  1.12 Gbits/sec                  receiver
[ 12]   0.00-30.00  sec  3.93 GBytes  1.13 Gbits/sec  421             sender
[ 12]   0.00-30.00  sec  3.93 GBytes  1.12 Gbits/sec                  receiver
[ 14]   0.00-30.00  sec  3.93 GBytes  1.13 Gbits/sec  829             sender
[ 14]   0.00-30.00  sec  3.93 GBytes  1.12 Gbits/sec                  receiver
[ 16]   0.00-30.00  sec  3.93 GBytes  1.13 Gbits/sec  1711             sender
[ 16]   0.00-30.00  sec  3.93 GBytes  1.12 Gbits/sec                  receiver
[ 18]   0.00-30.00  sec  3.94 GBytes  1.13 Gbits/sec  877             sender
[ 18]   0.00-30.00  sec  3.93 GBytes  1.12 Gbits/sec                  receiver
[SUM]   0.00-30.00  sec  31.5 GBytes  9.01 Gbits/sec  5940             sender
[SUM]   0.00-30.00  sec  31.4 GBytes  9.00 Gbits/sec                  receiver
Pico ITX iPerf3 Graph Results
⭐Quick Takeaways from our test results
- Line Saturation: Our simple network is running close to the full 10 Gbps line rate in both directions, with about 93.6% efficiency on uploads and around 90% on downloads.
- The Reverse Mode Retransmissions: In the regular test, our connection was flawless. However, notice how your total throughput dips slightly to 9.00 Gbits/sec in Reverse Mode. This is directly tied to the 5,940 retransmissions (Retr) logged by the sender.
- Stream Distribution: Across both tests, the traffic is balanced evenly across all 8 parallel streams (-P 8), with each individual stream steadily pushing roughly 1.12 to 1.17 Gbits/sec.
The bottom line
Please note that results can vary from one test to another. We also made some extra tweaks to our desktop PC’s network card settings to boost performance. Overall, the results are quite good.
We also took a look at the CPU usage of the K3 Pico-ITX.
In this test, we switched devices, with our Windows PC serving as the server and our K3 Pico-ITX acting as the client device. We ran a bash script on the Pico-ITX during the execution of the Iperf3 test commands and monitored the CPU utilization.
| Device No. | Device Name | IP Address | Description | Commands used |
| 1 | Desktop PC (Server) | 192.168.10.1 (Static IP) | – | iperf3 -s |
| 2 | Pico-ITX Mini PC (Client) | 192.168.10.2 (Static IP) | iperf_monitor.sh | iperf3 -c 192.168.10.2 -P 8 -t 30 -w 2M -R iperf3 -c 192.168.10.2 -P 8 -t 30 -w 2M mpstat -P ALL |
Our test script is called iperf_monitor.sh
#!/bin/bash

SERVER_IP="192.168.10.1"   # Windows server IP
LOGFILE="iperf_monitor_$(date +%Y%m%d_%H%M%S).log"

echo "=== iPerf3 CPU + Temperature Monitor ===" | tee -a "$LOGFILE"
echo "Log file: $LOGFILE" | tee -a "$LOGFILE"
echo "Target Server: $SERVER_IP" | tee -a "$LOGFILE"
echo "--------------------------------------------------------" | tee -a "$LOGFILE"

# -------------------------------
# Check required tools
# -------------------------------
command -v sensors >/dev/null 2>&1 || { echo "ERROR: sensors not installed" | tee -a "$LOGFILE"; exit 1;               }
command -v mpstat >/dev/null 2>&1 || { echo "ERROR: mpstat not installed (install sysstat)" | tee -a "$L              OGFILE"; exit 1; }
command -v iperf3 >/dev/null 2>&1 || { echo "ERROR: iperf3 not installed" | tee -a "$LOGFILE"; exit 1; }

# Create temporary files for background collection
MPSTAT_RAW=$(mktemp /tmp/mpstat_raw.XXXXXX)
TEMP_RAW=$(mktemp /tmp/temp_raw.XXXXXX)

# -------------------------------
# Start Background Monitoring
# -------------------------------
# 1. Continuous per-core CPU usage monitoring
mpstat -P ALL 1 > "$MPSTAT_RAW" &
MPSTAT_PID=$!

# 2. Continuous temperature tracking loop (1s intervals)
(
  while kill -0 $MPSTAT_PID 2>/dev/null; do
        sensors | grep -E 'Package id 0|Tctl|Tdie|CPU Temperature' >> "$TEMP_RAW"
        sleep 1
    done
) &
TEMP_PID=$!

# Give background utilities a brief window to spin up
sleep 0.5

# -------------------------------
# Run iPerf3 Tests
# -------------------------------
echo "Running iPerf3 test 1 (reverse mode)..." | tee -a "$LOGFILE"
iperf3 -c "$SERVER_IP" -P 8 -t 30 -w 2M -R | tee -a "$LOGFILE"
echo "--------------------------------------------------------" | tee -a "$LOGFILE"

echo "Running iPerf3 test 2 (forward mode)..." | tee -a "$LOGFILE"
iperf3 -c "$SERVER_IP" -P 8 -t 30 -w 2M | tee -a "$LOGFILE"
echo "--------------------------------------------------------" | tee -a "$LOGFILE"

# -------------------------------
# Stop Monitoring & Process Data
# -------------------------------
kill $MPSTAT_PID 2>/dev/null
wait $MPSTAT_PID 2>/dev/null

{
    echo ""
    echo "========================================================"
    echo "       METRICS SUMMARY REPORT (DURING TEST)"
    echo "========================================================"

    # 1. Process and report Peak/Average Temperatures
    if [ -s "$TEMP_RAW" ]; then
        echo "--- Temperature Profile ---"
        awk '
            # Extract numbers from lines containing temperatures
            {
                for(i=1; i<=NF; i++) {
                    if($i ~ /^[+-]?[0-9]+\.[0-9]+/ ) {
                        val = $i + 0 # Force numeric evaluation
                        sum += val
                        count++
                        if(val > max || max == "") max = val
                    }
                }
            }
            END {
                if(count > 0) {
                    printf "Peak Temperature    : %.1f°C\n", max
                    printf "Average Temperature : %.1f°C\n", sum/count
                } else {
                    print "No numeric temperature readings parsed."
                }
    }
        ' "$TEMP_RAW"
        echo ""
    fi

    # 2. Parse the raw mpstat output to map peak loads per core
    echo "--- Per-Core Peak CPU Utilization ---"
    echo -e "CPU Core\tPeak Utilization"
    echo -e "--------\t----------------"

    awk '
        # Find column layout dynamically (shields against AM/PM column shift variations)
        /CPU/ && !/Linux/ {
            for(i=1; i<=NF; i++) {
                if($i == "CPU") cpu_col=i;
                if($i == "%idle") idle_col=i;
            }
            next;
        }
        # Gather metrics from matching data tracks
        cpu_col > 0 && idle_col > 0 {
            cpu = $cpu_col
            idle = $idle_col
            if (cpu ~ /^[0-9]+$/ || cpu == "all") {
                util = 100 - idle
                if (util > max[cpu]) max[cpu] = util
            }
        }
        END {
            for (cpu in max) {
                if (cpu != "all") print cpu, max[cpu]
            }
            if ("all" in max) print "ALL_TOTAL", max["all"]
        }
    ' "$MPSTAT_RAW" | sort -n | awk '
        /ALL_TOTAL/ { all_val=$2; next }
        { printf "Core %-3s\t%.2f%%\n", $1, $2 }
        END {
            if(all_val) {
                printf "--------\t----------------\n"
                printf "SYSTEM PEAK\t%.2f%% (Overall core average spike)\n", all_val
            }
        }
    '
    echo "========================================================"
} >> "$LOGFILE"

echo "Monitoring complete. Combined results saved to: $LOGFILE"
command -v mpstat >/dev/null 2>&1 || { echo "ERROR: mpstat not installed (install sysstat)" | tee -a "$LOGFILE"; exit 1; }
========================================================
       METRICS SUMMARY REPORT (DURING Iperf3 TEST)
========================================================
--- Per-Core Peak CPU Utilization ---
CPU Core        Peak Utilization
--------        ----------------
Core 0          24.21%
Core 1          23.16%
Core 2          27.27%
Core 3          57.14%
Core 4          47.37%
Core 5          35.71%
Core 6          42.65%
Core 7          27.45%
Core 8          0.00%
Core 9          0.00%
Core 10         0.00%
Core 11         0.00%
Core 12         0.00%
Core 13         0.00%
Core 14         0.00%
Core 15         0.00%
--------        ----------------
SYSTEM PEAK     11.67% (Overall core average spike)
========================================================
K3 Pico ITX iPerf3 (CPU Utilization)
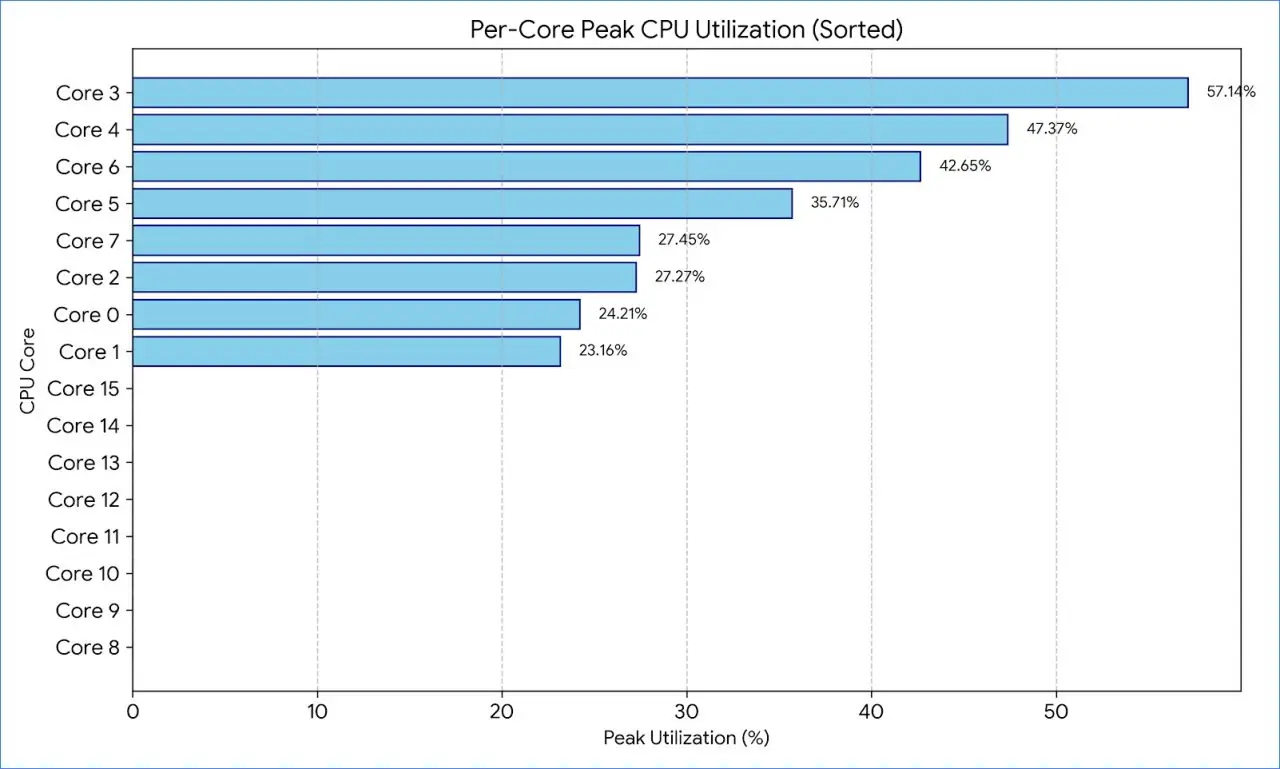
Key Observations from the Metrics:
- Active Cores: The general-purpose cluster (Cores 0–7)—the true active cluster average spike sits at 35.62%.
- Idle Cores: Cores 8 through 15 stayed completely idle (0.00% utilization) during the test, since they’re reserved exclusively for AI and vector acceleration tasks.
- Overall System Peak: Indicates a moderate-to-heavy multi-threaded demand on the primary CPU cores, spearheaded by Core 3 driving the primary thread at 57.14%.
Core 3 hit 57.14% usage, while the other general cores stayed around 23%–24%. This points to a single-threaded bottleneck, where one main thread is handling a huge chunk of sequential work while the other general-purpose cores sit idle.
Improving performance by optimizing operating system governors
If CPU core utilization seems high, it could be because the Linux kernel has lowered the clock speed to save power. When a core runs at a reduced frequency (e.g., 1.0 GHz) instead of its maximum 1.6 GHz, tasks take up a larger percentage of its available capacity.
- How to do it: Switching the CPU governor to performance mode makes the cores run at their maximum clock speed, allowing tasks to finish faster and potentially reducing peak utilization percentages.
echo performance | sudo tee /sys/devices/system/cpu/cpu*/cpufreq/scaling_governor

