Measuring Power, Wattage, and Temperatures
Power usage
Both the Orange Pi 6 and Orange Pi 6 Plus require a USB Power Delivery (PD) input of 20V and should be powered with a high-capacity adapter rated between 65W and 100W. For optimal performance during heavy multi-core and AI workloads, a 100W/5A adapter is recommended.
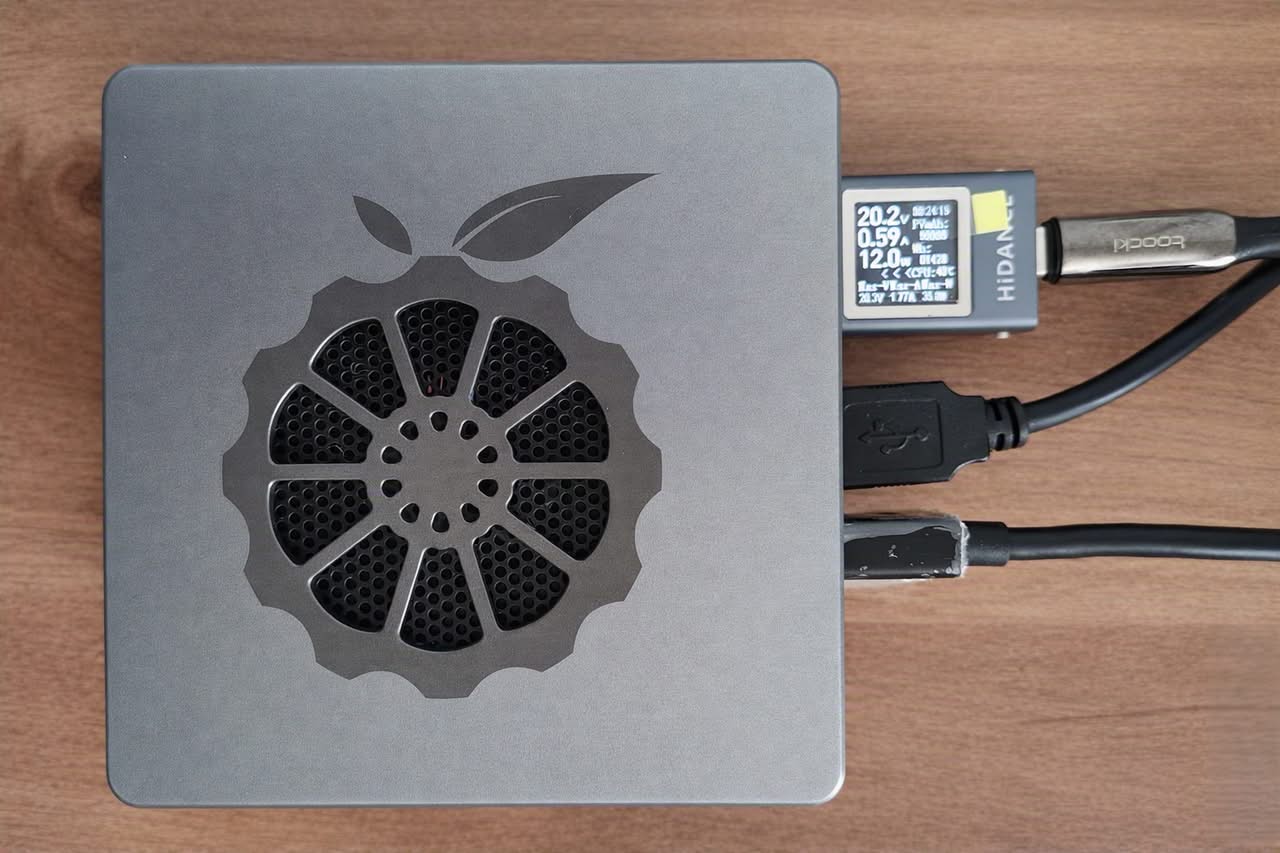
Based on our testing, the typical wattage during standard operation ranges from 12 to 14 watts, reaching approximately 27 watts during non-peak usage. Keep in mind that during heavier usage, especially when running local LLMS, the peak wattage can be much higher.
In our tests, we used our high-quality Ugoos 140W GaN Power Adapter, which includes two Type-C ports and supports 20V input. If you’re seeking the best affordable option, the Orange Pi Official PD 100W Type-C Power Supply, priced at around $15, should be sufficient.
Testing power consumption and wattage usage in idle mode (very light on resource usage).
Working temperatures
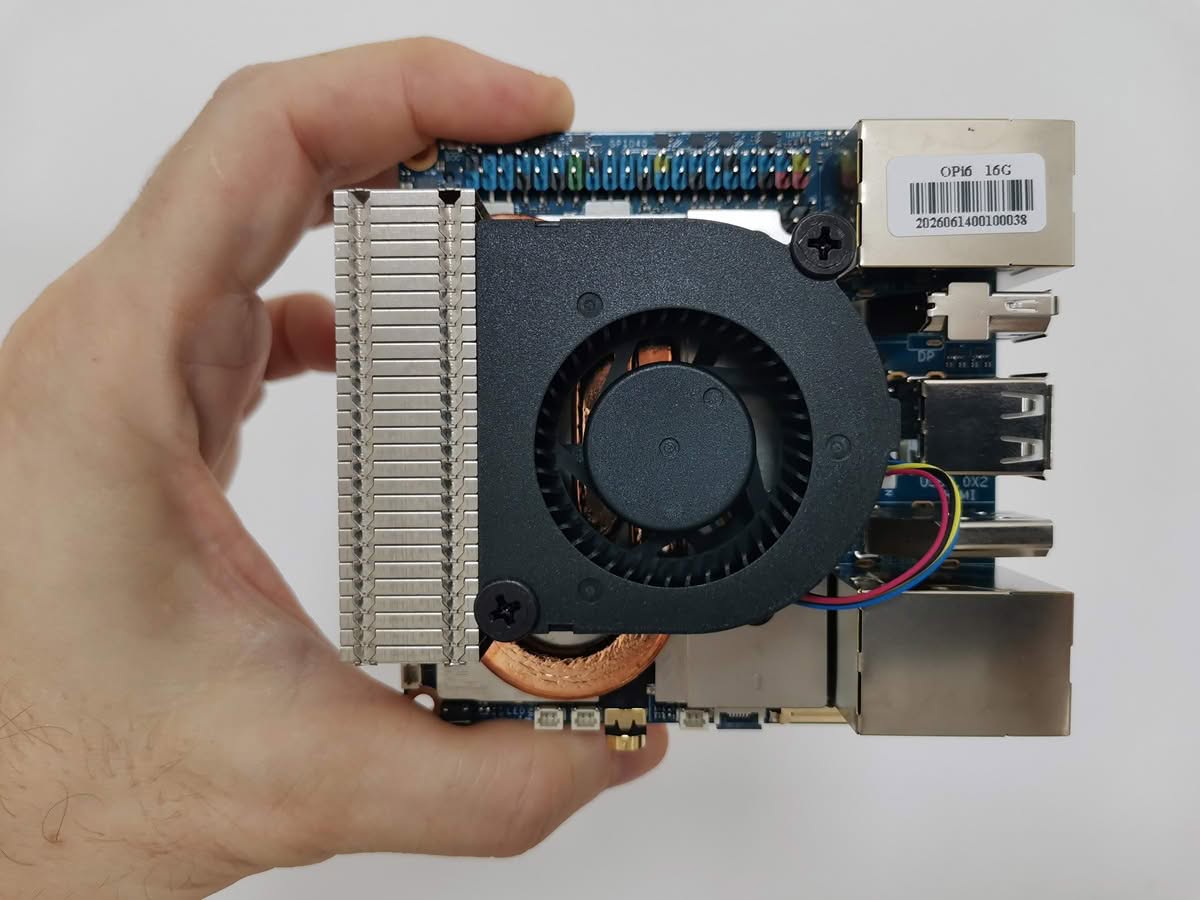
In general, the Opi 6 board does not overheat thanks to the robust cooling system that is installed above the main components. Even under heavy loads on system resources, you can expect temperatures to remain within the acceptable range of 43°C to over 50°C.
root@orangepi6:/mnt/ssd# sensors

acpitz-acpi-0
Adapter: ACPI interface
temp1:        +44.0°C
temp2:        +43.0°C
temp3:        +45.0°C
temp4:        +46.0°C
temp5:        +46.0°C
temp6:        +44.0°C
temp7:        +44.0°C
temp8:        +46.0°C
temp9:        +44.0°C
temp10:       +44.0°C
temp11:       +43.0°C
temp12:       +45.0°C
temp13: +44.0°C| Sensor Name | Value | Description |
| temp1 | +44.0 °C | ACPI Thermal Zone 1 (System / SoC Core Region) |
| temp2 | +43.0 °C | ACPI Thermal Zone 2 (System / Peripheral Block) |
| temp3 | +45.0 °C | ACPI Thermal Zone 3 (Memory / Bus Controller Region) |
| temp4 | +46.0 °C | ACPI Thermal Zone 4 (High-Density Core / GPU Cluster) |
| temp5 | +46.0 °C | ACPI Thermal Zone 5 (High-Density Core / NPU Cluster) |
| temp6 | +44.0 °C | ACPI Thermal Zone 6 (I/O & Storage Controller Region) |
| temp7 | +44.0 °C | ACPI Thermal Zone 7 (System / Ambient Board Region) |
| temp8 | +46.0 °C | ACPI Thermal Zone 8 (CPU High-Performance Cluster) |
| temp9 | +44.0 °C | ACPI Thermal Zone 9 (Multimedia / Video Processing Subsystem) |
| temp10 | +44.0 °C | ACPI Thermal Zone 10 (PCIe / NVMe Host Controller Region) |
| temp11 | +43.0 °C | ACPI Thermal Zone 11 (Power Management / VRM Region) |
| temp12 | +45.0 °C | ACPI Thermal Zone 12 (Secondary CPU Cluster / System Bus) |
| temp13 | +44.0 °C | ACPI Thermal Zone 13 (Board Thermal Monitoring Zone) |
(Note: Generic Linux ACPI drivers export generic temp1–temp13 labels via acpitz. The descriptions above reflect the standard functional block distribution mapped by standard Rockchip/ARM kernel thermal zones.
Running benchmarks, stressing main components, and checking temperatures.
This script serves as a benchmark runner with temperature monitoring capabilities. After each test, it halts the logger and calculates the minimum, maximum, and average temperatures recorded during that run. It executes five performance tests in sequence: CPU, memory, storage, GPU, and stress. Each test lasts roughly 2 minutes, making the entire suite take around 10 minutes to complete. During each test, a background loop runs that queries the sensors every 5 seconds to log the system temperatures.
After each test, it stops the logger and calculates the minimum, maximum, and average temperature recorded during that run.
It runs five performance tests (CPU, memory, storage, GPU, and stress) one after another.
Each test lasts about 2 minutes, so the whole suite finishes in ~10 minutes.
While each test runs, it starts a background loop that calls sensors every 5 seconds to log system temperatures.
#!/bin/bash
# run_benchmarks_with_temps.sh
# Complete benchmark suite with temperature logging via sensors
# Total runtime ~10-12 minutes

REPORT=./benchmark_report.txt
echo "=== Benchmark Report with Temperatures ===" > "$REPORT"

# Helper function: run a test + log temps
run_test() {
  NAME=$1
  CMD=$2
  LOG=./${NAME}_temps.log

  echo "----------------------------------------" | tee -a "$REPORT"
  echo "Running $NAME..." | tee -a "$REPORT"

  # Ensure previous log is cleared
  > "$LOG"

  # Background temperature logger
  (
    while true; do
      echo "=== $(date) ===" >> "$LOG"
      sensors >> "$LOG" 2>&1
      sleep 5
    done
  ) &
  MON_PID=$!

  # Ensure background logger dies on script exit or interrupt (Ctrl+C)
  trap 'kill -9 $MON_PID 2>/dev/null' EXIT INT TERM

  # Run the benchmark command
  eval "$CMD" | tee "${NAME}_output.txt"

  # Stop background logger cleanly
  kill -9 "$MON_PID" 2>/dev/null
  trap - EXIT INT TERM

  # Extract temps: match 'tempX:' lines and parse floating point degrees C
  TEMPS=$(grep -E 'temp[0-9]+:' "$LOG" | grep -oP '\+\s*\K[0-9]+\.[0-9]+' | awk '$1>0')

  MIN=$(echo "$TEMPS" | awk 'NR==1{min=$1} {if($1<min)min=$1} END{print min}')
  MAX=$(echo "$TEMPS" | awk 'NR==1{max=$1} {if($1>max)max=$1} END{print max}')
  AVG=$(echo "$TEMPS" | awk '{sum+=$1; count++} END{if(count>0) printf "%.1f", sum/count}')

  if [ -n "$MIN" ] && [ -n "$MAX" ] && [ -n "$AVG" ]; then
    echo "$NAME Temps: Min=${MIN}°C, Max=${MAX}°C, Avg=${AVG}°C" | tee -a "$REPORT"
  else
    echo "$NAME Temps: No temperature data captured" | tee -a "$REPORT"
  fi
  echo "" >> "$REPORT"
}

# === Ensure required packages are present ===
if ! command -v stress-ng &> /dev/null; then
  echo "Installing missing dependencies (stress-ng)..."
  apt update && apt install -y stress-ng
fi

# === Execute Benchmark Suite ===
run_test "CPU_sysbench" "sysbench cpu --threads=\$(nproc) --time=120 run"
run_test "Memory_sysbench" "sysbench memory --threads=\$(nproc) --time=120 run"
run_test "Storage_fio" "fio --name=randrw --rw=randrw --size=512M --bs=4k --numjobs=2 --runtime=120 --group_reporting"
run_test "GPU_glmark2" "XDG_RUNTIME_DIR=/run/user/1000 WAYLAND_DISPLAY=wayland-0 glmark2-es2-wayland"
run_test "StressNG" "stress-ng --cpu 0 --vm 2 --timeout 120 --metrics-brief"

echo "=== All tests complete. See $REPORT for compiled summary. ==="
Test results
Based on the results presented below, the board did not cool significantly, indicating that the active heatsink is functioning as expected.
| Benchmark Test | Core Metric / Score | Read Throughput | Write Throughput | Min Temp | Max Temp | Avg Temp | Status / Duration |
| CPU (sysbench) | 26,613.61 eps | — | — | 45.0°C | 60.0°C | 52.4°C | Completed (12 threads, 120s) |
| Memory (sysbench) | 22,002,165.74 ops/sec | — | 21.49 GB/s (21,486.49 MiB/s) | 51.0°C | 57.0°C | 53.7°C | Completed (1KiB block write) |
| Storage (fio) | 990 total IOPS | 1.98 MB/s (494 IOPS) | 1.99 MB/s (496 IOPS) | 47.0°C | 56.0°C | 49.2°C | Completed (4k RandRW, 512M) |
| GPU (glmark2) | 3,408 Score | — | — | 46.0°C | 54.0°C | 50.4°C | Completed (Mali-G720 Wayland) |
| StressNG | 2,087.95 CPU bogo ops/s 110,558.40 VM bogo ops/s | — | — | 50.0°C | 72.0°C | 59.7°C | Completed (12 CPU, 2 VM, 120s) |
Key Takeaways from Our Results
- Thermal Performance: Our highest thermal peak reached 72.0°C under maximum synthetic load (
StressNG). This gives a safe 10°C–13°C headroom before the SoC encounters hardware thermal throttling (~83°C–85°C). - GPU Benchmark: The 3,408 glmark2 score confirms full hardware acceleration on the Mali-G720-Immortalis core under Wayland.