Installing the NVMe and Wi-Fi Card
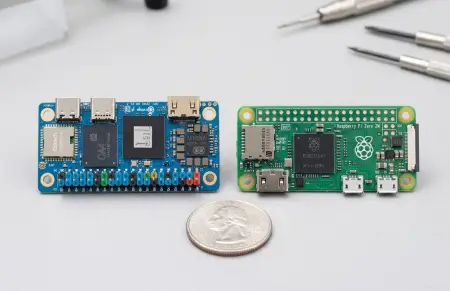
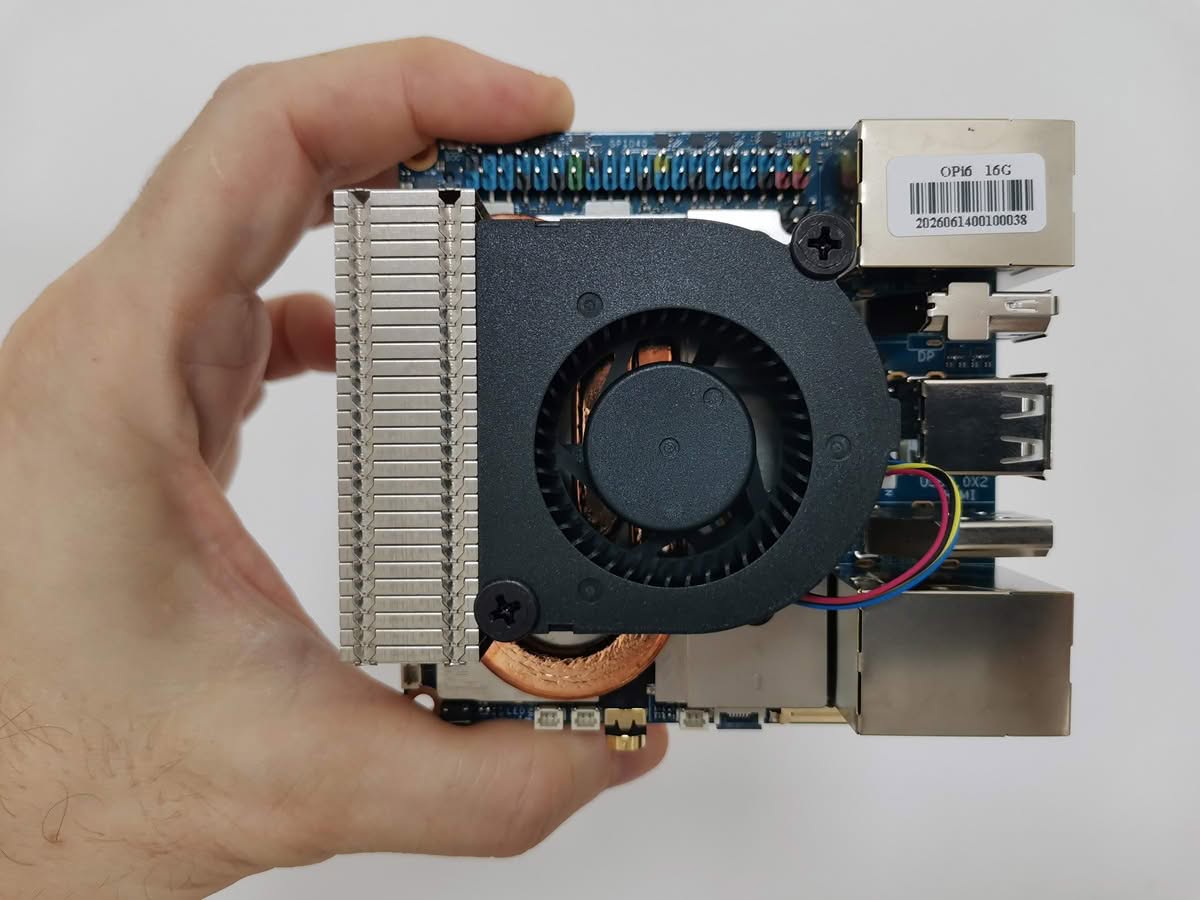
The Opi 6 board includes two M.2 2280 NVMe slots and an M.2 2230 Key E slot for installing a Wi-Fi/Bluetooth card. In our setup, we installed an XrayDisk 1TB Pro PCIe Gen3 X4 NVMe drive. If you are running low on NVMe storage and intend to use the device as a NAS, you can connect an external HDD to one of the two available USB 3.0 ports on the board. In this less-than-ideal configuration, we used basic wire-type antennas, which should deliver decent performance.
Installing NVMe and WiFi Card
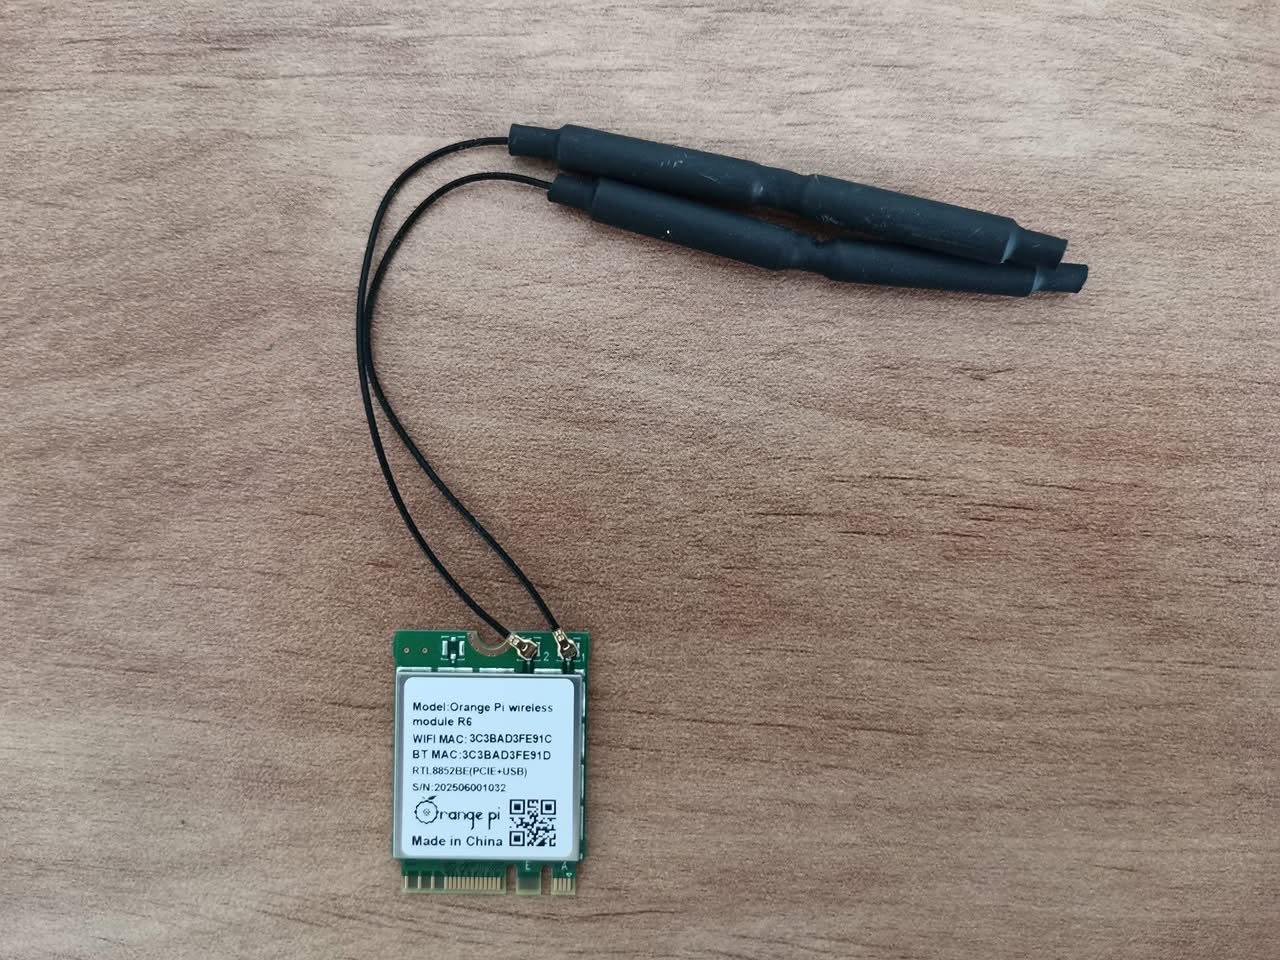
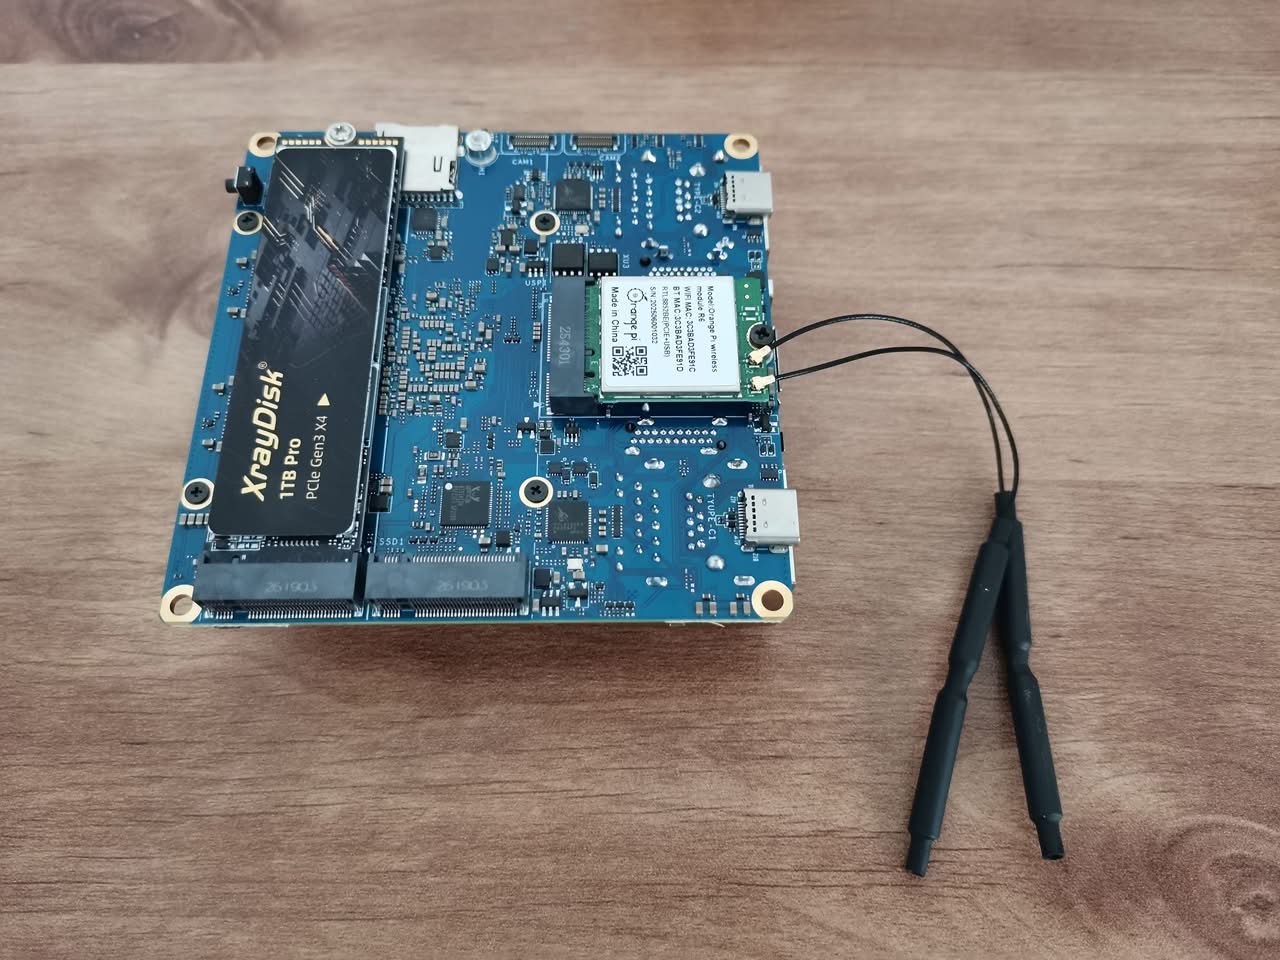
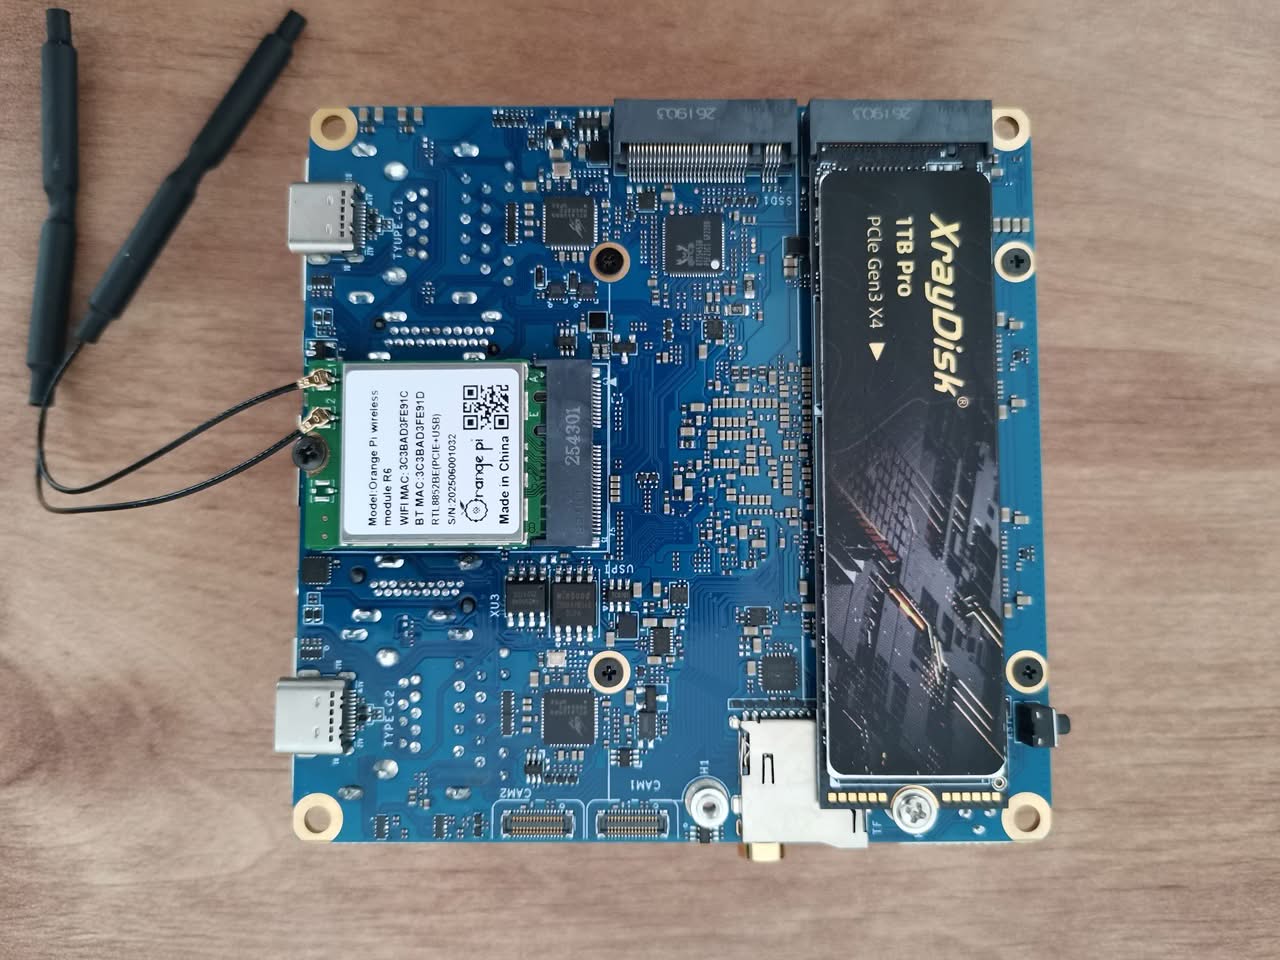
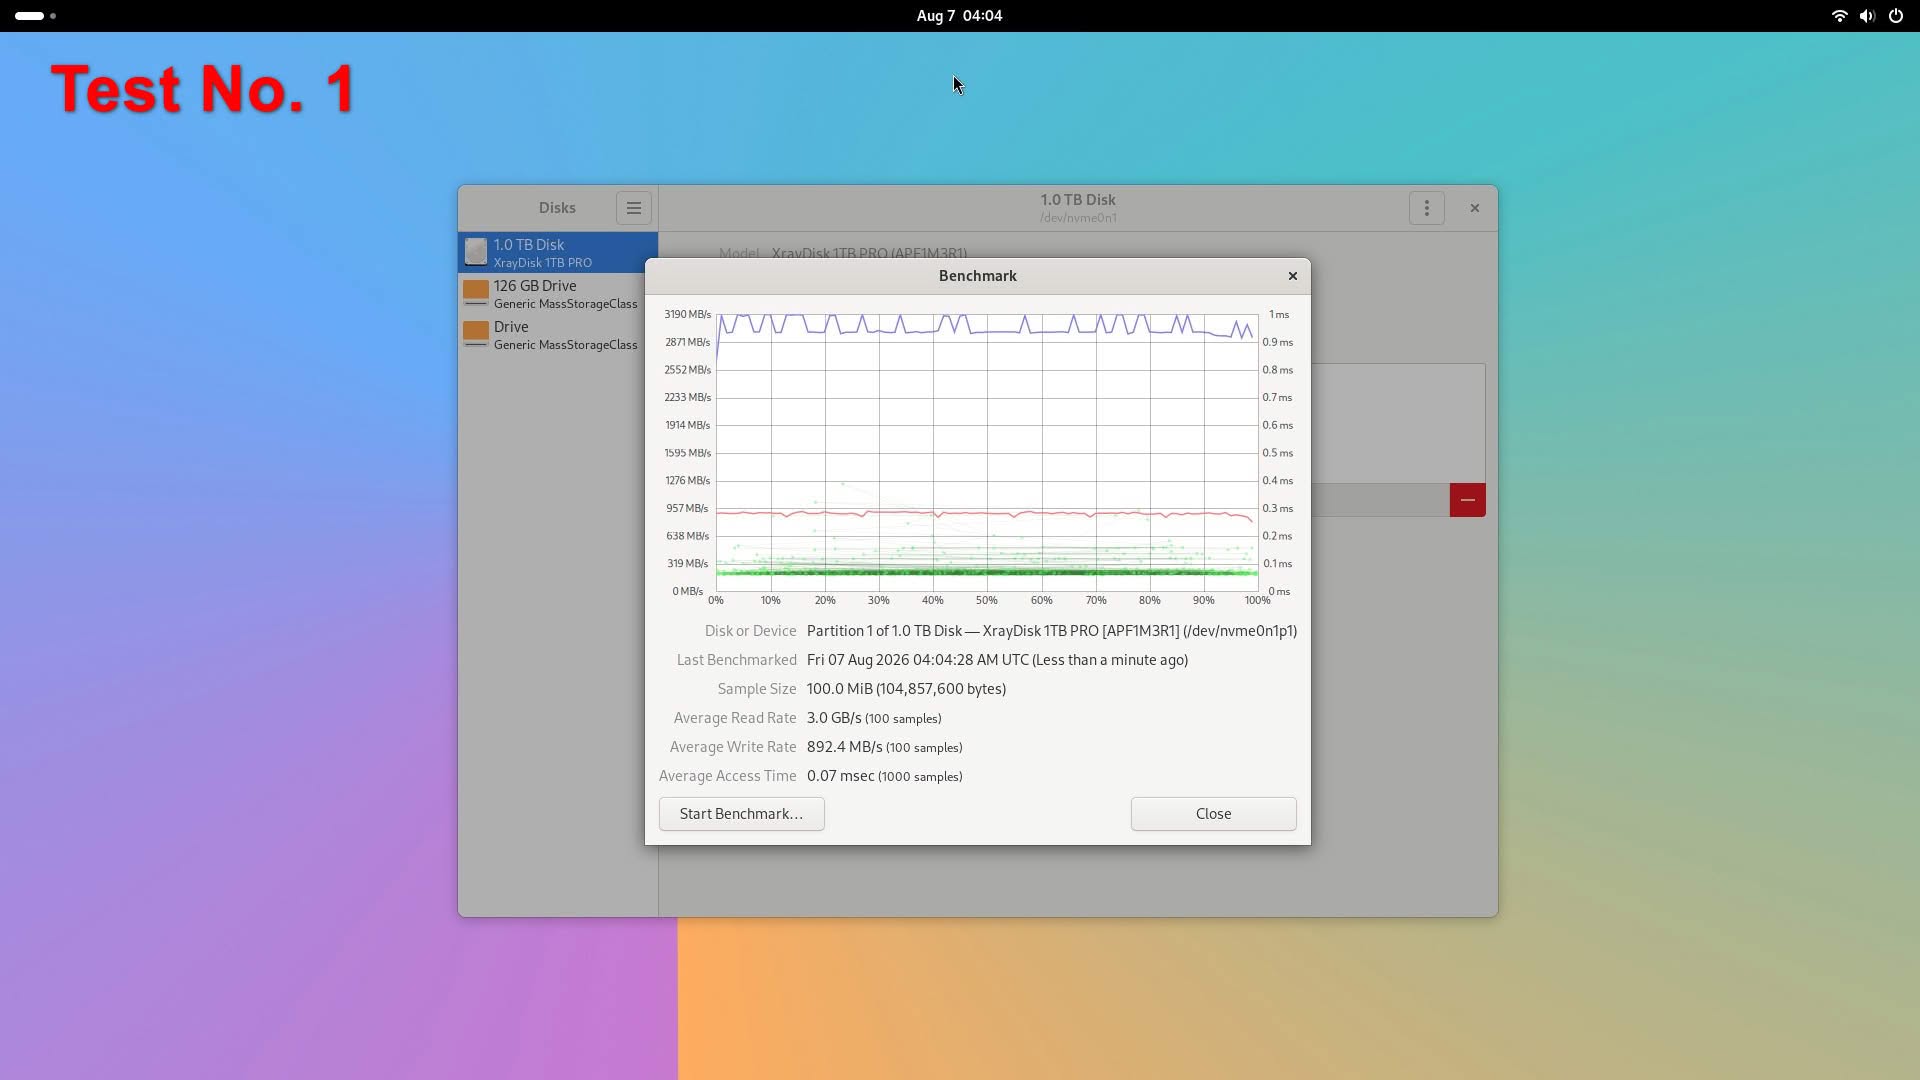
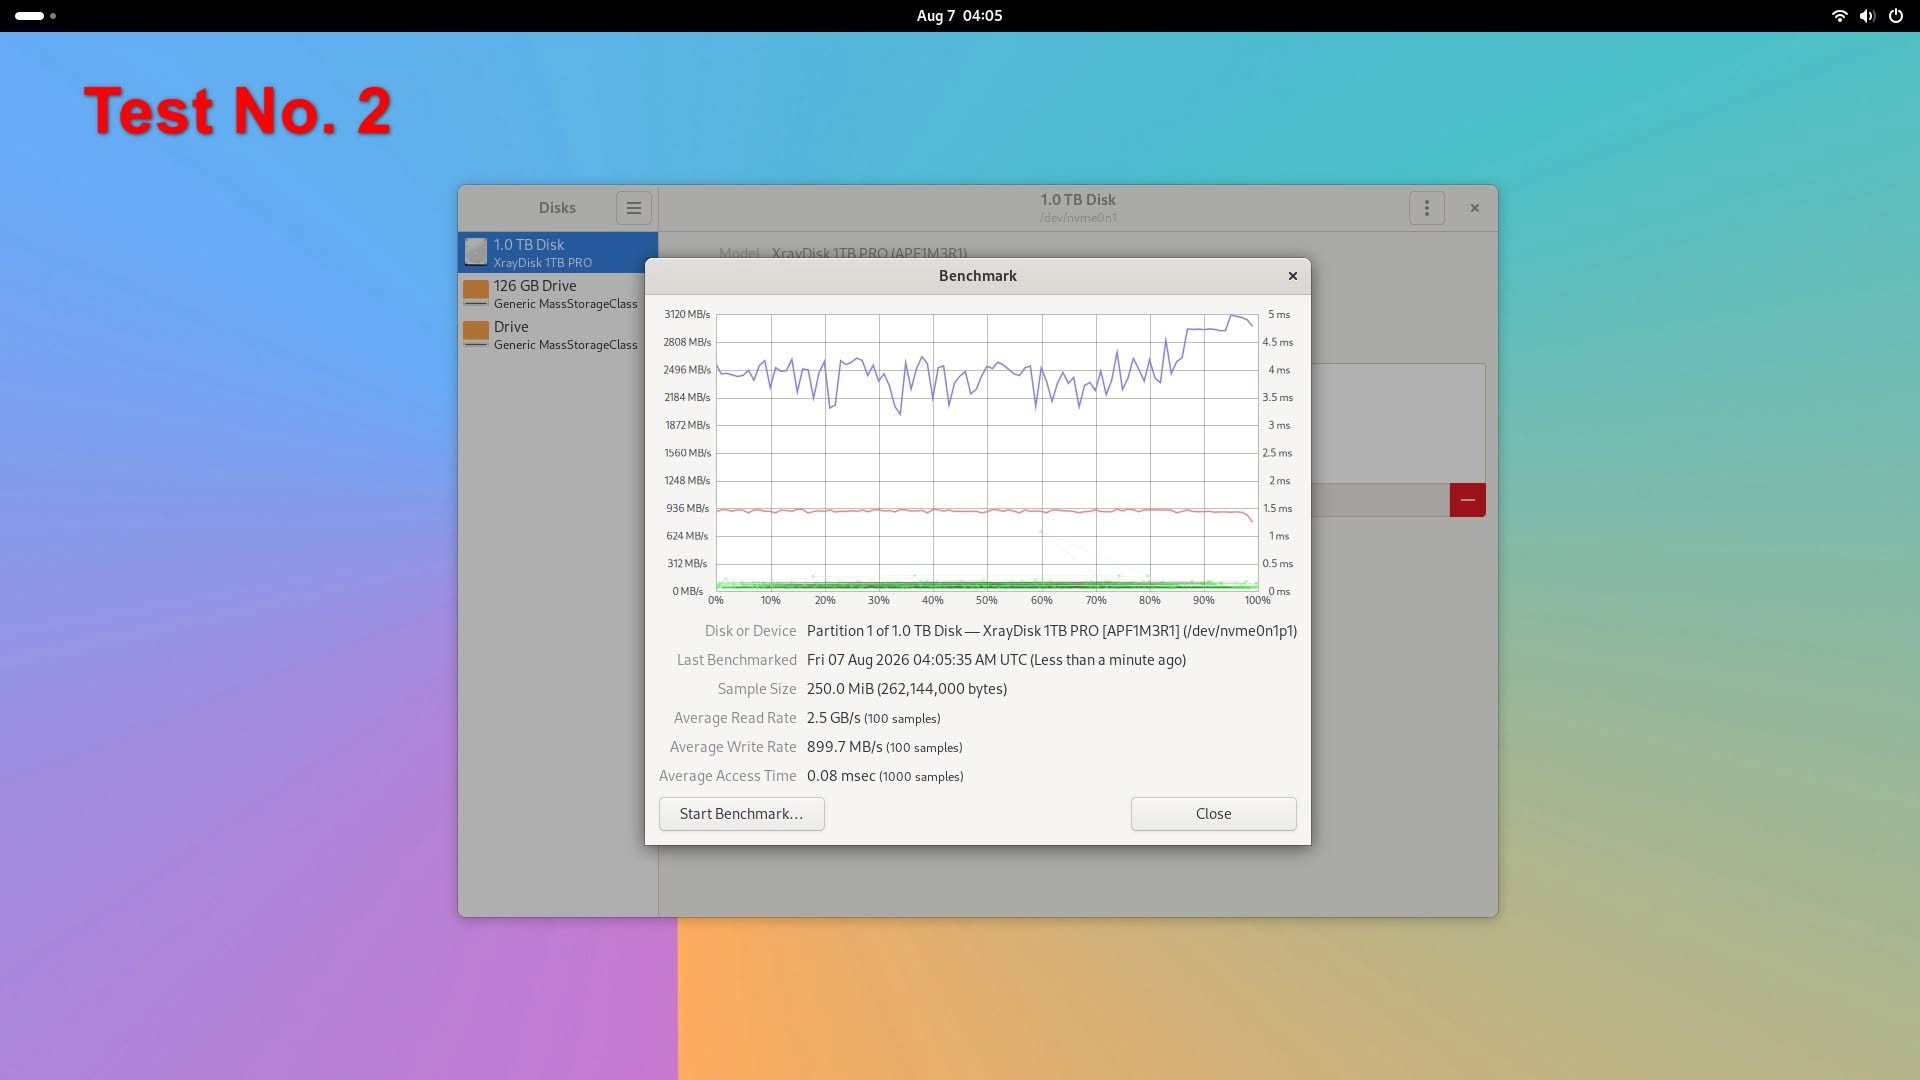
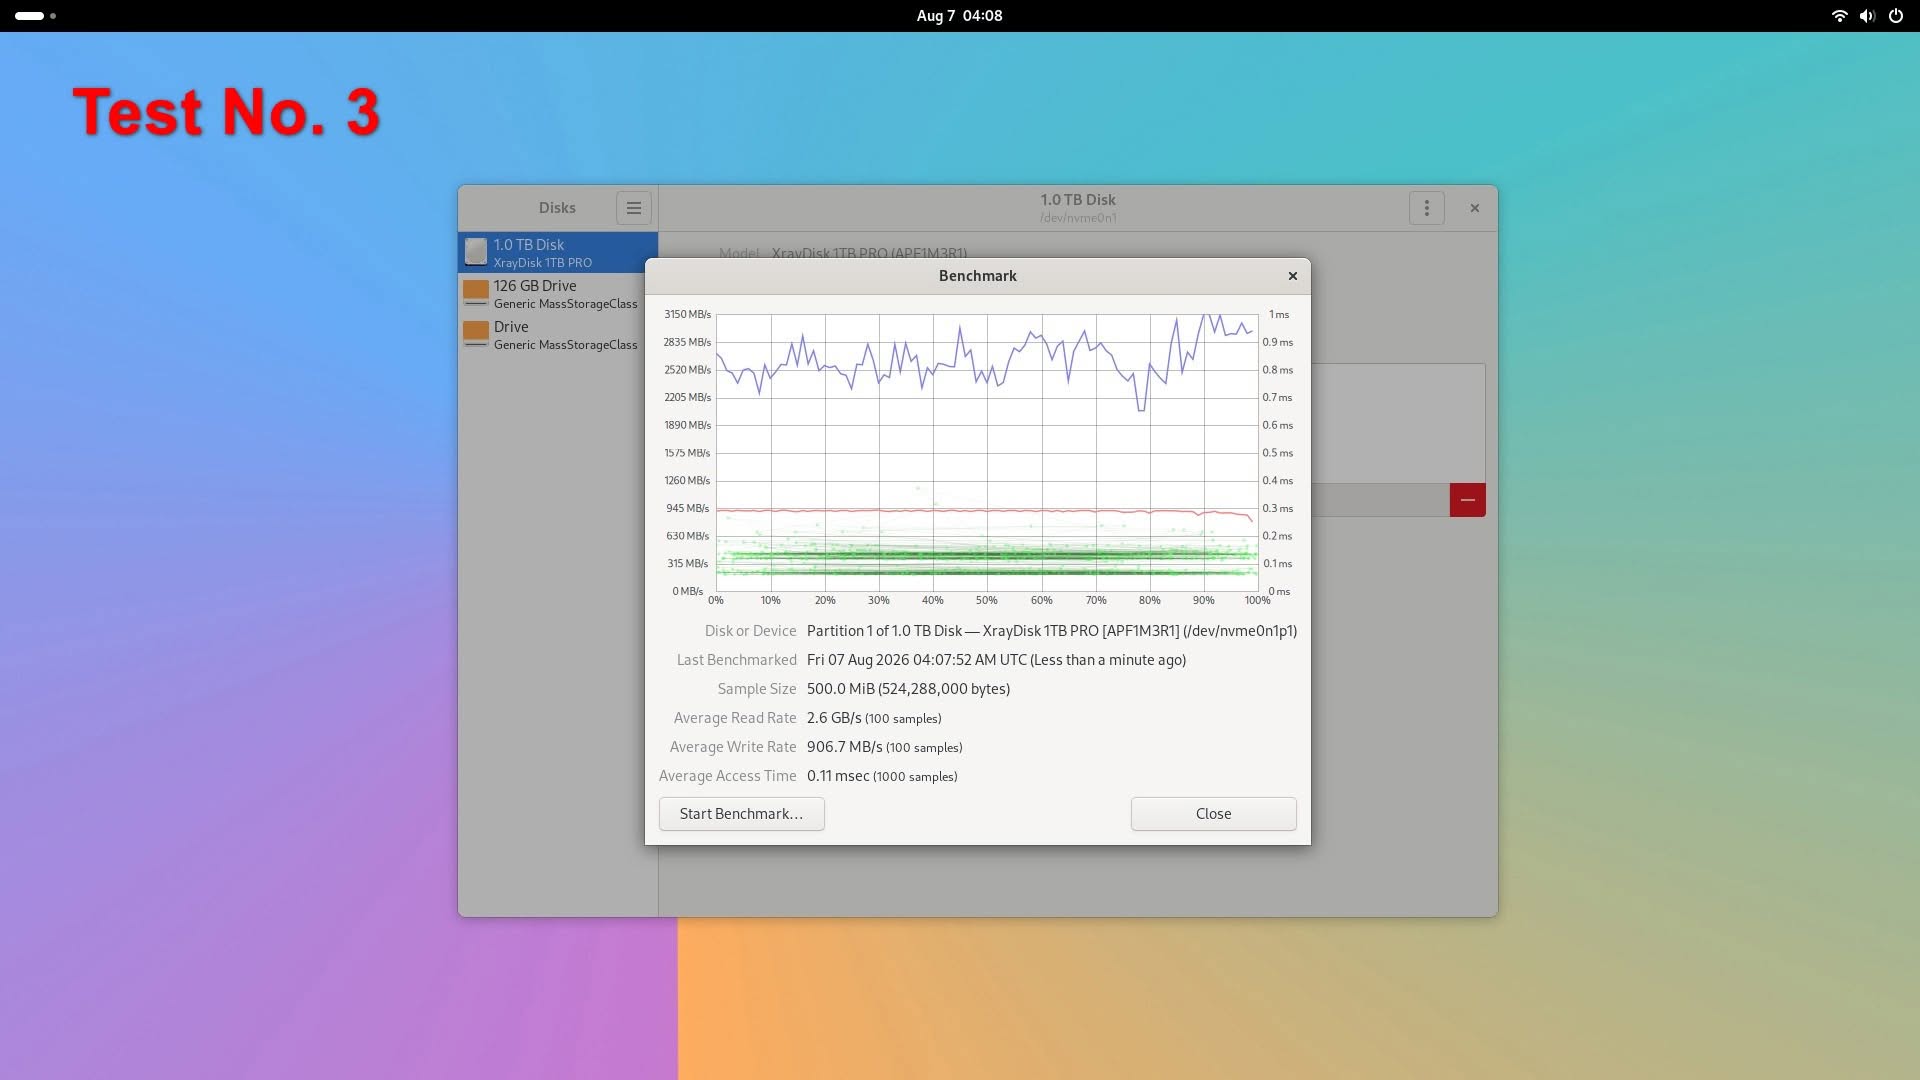
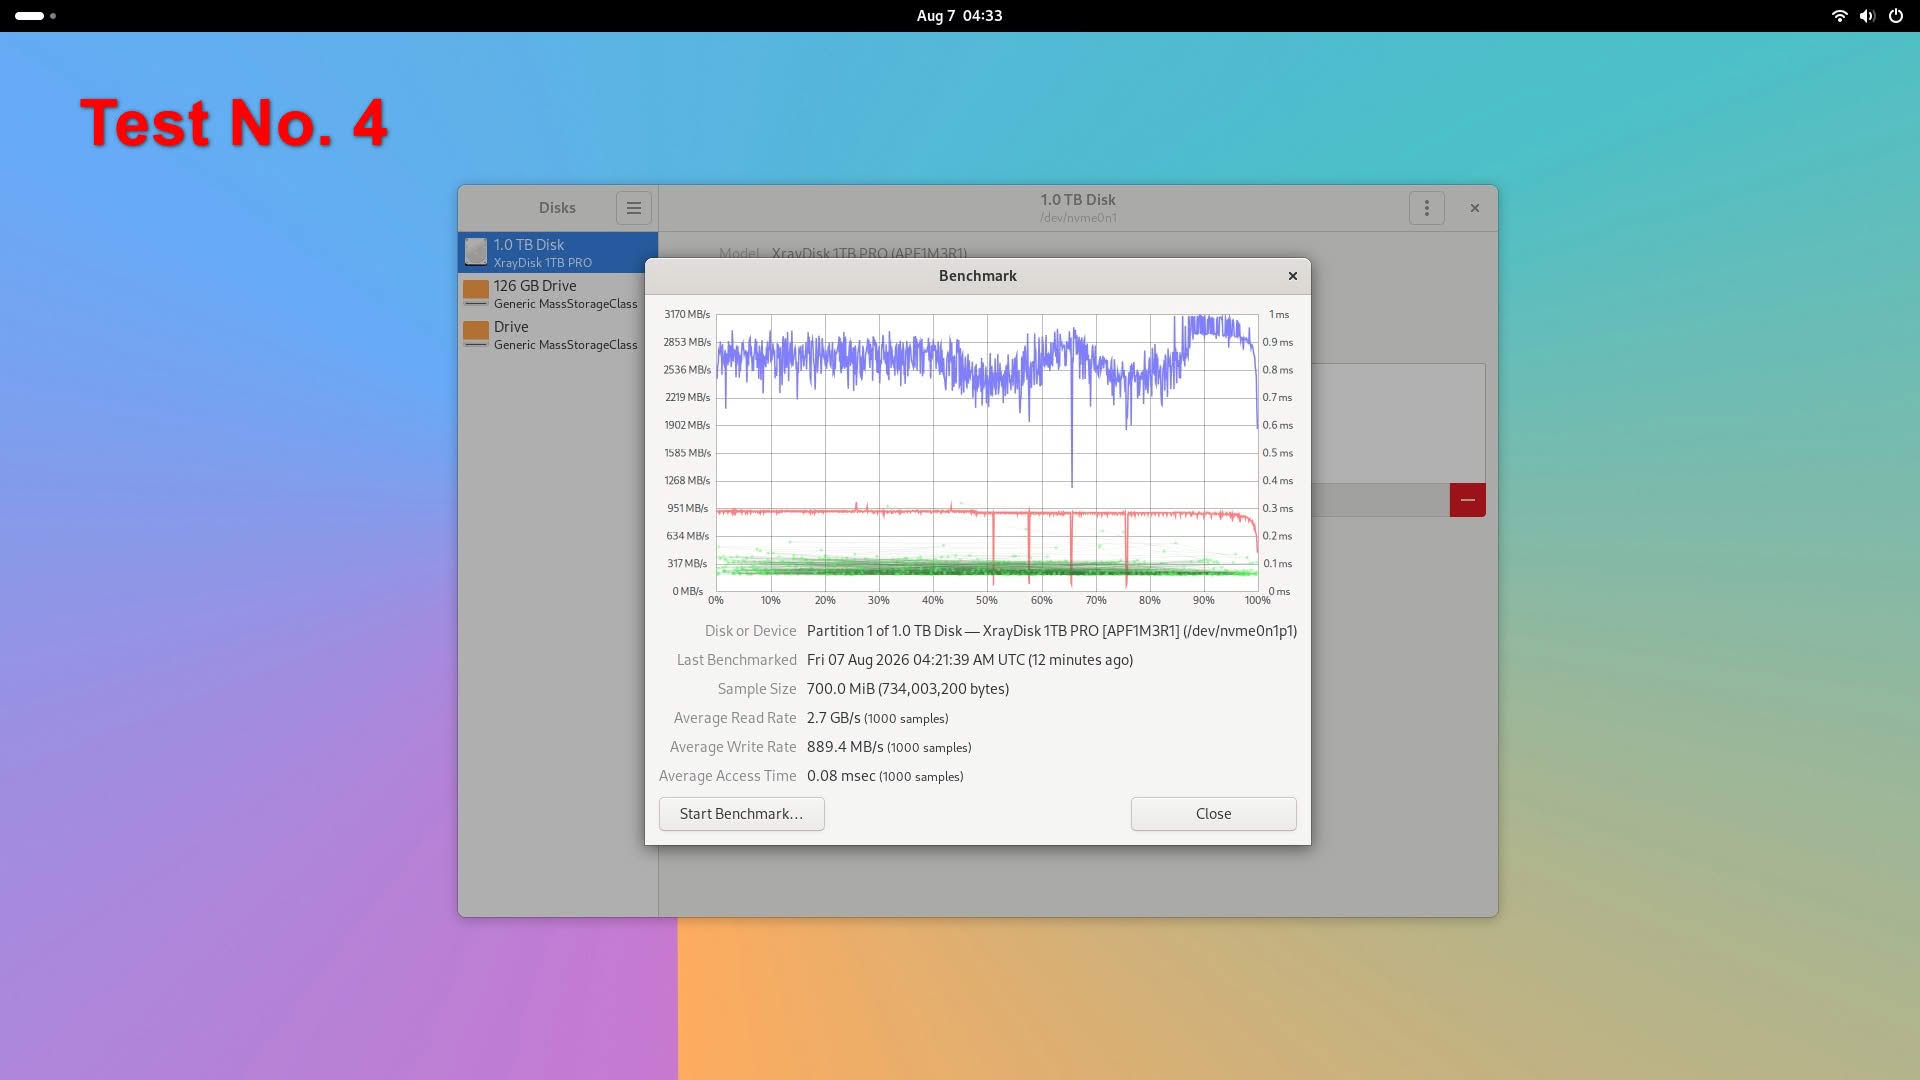
GNOME Disks (gnome-disk-utility) Benchmarking (Read & Write)
| Brand | Filesystem | Model/Description | Capacity |
| XrayDisk | ext4 | Pro PCIe Gen3 X4 NVMe drive | 1TB |
| Test No. | Test Sample Size (MiB) | No. of Samples | Results |
| 1 | 100MiB | 100 | Read: 3.0 GB/s Write: 892.4 MB/s |
| 2 | 250MiB | 100 | Read: 2.5 GB/s Write: 899.7 MB/s |
| 3 | 500MiB | 100 | Read: 2.6 GB/s Write: 906.7 MB/s |
| 4 | 700MiB | 1000 | Read: 2.7 GB/s Write: 889.4 MB/s |
GNOME Disks Test resuls (Screenshots)
Fio Benchmarking
This test measures true sequential read throughput from the NVMe device, bypassing Linux caching. It tells you the real maximum read speed your SBC’s PCIe link and NVMe controller can sustain.
#Test No. 1: Sequential Read (500M benchmark file)

fio --name=seqread --filename=/mnt/nvme/testfile --size=500M --bs=1M --rw=read --direct=1 --ioengine=io_uring --iodepth=16 --numjobs=1 --time_based --runtime=30 --fallocate=none --status-interval=1
#Test No. 1: Results
seqread: (g=0): rw=read, bs=(R) 1024KiB-1024KiB, (W) 1024KiB-1024KiB, (T) 1024KiB-1024KiB, ioengine=io_urin g, iodepth=16
fio-3.36
Starting 1 process
seqread: Laying out IO file (1 file / 500MiB)
seqread: (groupid=0, jobs=1): err= 0: pid=5739: Fri Aug 7 06:18:10 2026
read: IOPS=2771, BW=2717MiB/s (2849MB/s)(856MiB/315msec)
slat (usec): min=10, max=401, avg=59.25, stdev=54.30
clat (usec): min=1399, max=18278, avg=5779.85, stdev=2587.71
lat (usec): min=1496, max=18348, avg=5839.23, stdev=2573.73
clat percentiles (usec):
| 1.00th=[ 1647], 5.00th=[ 2147], 10.00th=[ 2573], 20.00th=[ 3687],
| 30.00th=[ 4490], 40.00th=[ 4948], 50.00th=[ 5276], 60.00th=[ 5997],
| 70.00th=[ 6587], 80.00th=[ 7635], 90.00th=[ 9372], 95.00th=[10814],
| 99.00th=[13304], 99.50th=[14615], 99.90th=[18220], 99.95th=[18220],
| 99.99th=[18220]
lat (msec) : 2=3.67%, 4=20.16%, 10=66.67%, 20=7.67%
cpu : usr=0.63%, sys=16.19%, ctx=727, majf=0, minf=525
IO depths : 1=0.1%, 2=0.2%, 4=0.5%, 8=0.9%, 16=98.3%, 32=0.0%, >=64=0.0%
submit : 0=0.0%, 4=100.0%, 8=0.0%, 16=0.0%, 32=0.0%, 64=0.0%, >=64=0.0%
complete : 0=0.0%, 4=100.0%, 8=0.0%, 16=0.0%, 32=0.0%, 64=0.0%, >=64=0.0%
issued rwts: total=873,0,0,0 short=0,0,0,0 dropped=0,0,0,0
latency : target=0, window=0, percentile=100.00%, depth=16
Run status group 0 (all jobs):
READ: bw=2717MiB/s (2849MB/s), 2717MiB/s-2717MiB/s (2849MB/s-2849MB/s), io=856MiB (898MB), run=315-315ms ec
Disk stats (read/write):
nvme0n1: ios=6859/0, sectors=1755904/0, merge=0/0, ticks=36127/0, in_queue=36127, util=67.15%
Jobs: 1 (f=1)
seqread: (groupid=0, jobs=1): err= 0: pid=5739: Fri Aug 7 06:18:11 2026
read: IOPS=2730, BW=2716MiB/s (2848MB/s)(3572MiB/1315msec)
slat (usec): min=10, max=411, avg=55.43, stdev=52.17
clat (usec): min=1274, max=18278, avg=5807.89, stdev=2476.98
lat (usec): min=1345, max=18348, avg=5863.31, stdev=2463.86
clat percentiles (usec):
| 1.00th=[ 1647], 5.00th=[ 2147], 10.00th=[ 2671], 20.00th=[ 3785],
| 30.00th=[ 4686], 40.00th=[ 4948], 50.00th=[ 5342], 60.00th=[ 6063],
| 70.00th=[ 6849], 80.00th=[ 7701], 90.00th=[ 8979], 95.00th=[10421],
| 99.00th=[12911], 99.50th=[13960], 99.90th=[16319], 99.95th=[17695],
| 99.99th=[18220]
bw ( MiB/s): min= 2698, max= 2714, per=99.62%, avg=2706.00, stdev=11.31, samples=2
iops : min= 2698, max= 2714, avg=2706.00, stdev=11.31, samples=2
lat (msec) : 2=3.82%, 4=18.22%, 10=71.31%, 20=6.21%
cpu : usr=0.84%, sys=15.21%, ctx=3201, majf=0, minf=526
IO depths : 1=0.1%, 2=0.1%, 4=0.1%, 8=0.2%, 16=99.6%, 32=0.0%, >=64=0.0%
submit : 0=0.0%, 4=100.0%, 8=0.0%, 16=0.0%, 32=0.0%, 64=0.0%, >=64=0.0%
complete : 0=0.0%, 4=100.0%, 8=0.0%, 16=0.0%, 32=0.0%, 64=0.0%, >=64=0.0%
issued rwts: total=3590,0,0,0 short=0,0,0,0 dropped=0,0,0,0
latency : target=0, window=0, percentile=100.00%, depth=16
Run status group 0 (all jobs):
READ: bw=2716MiB/s (2848MB/s), 2716MiB/s-2716MiB/s (2848MB/s-2848MB/s), io=3572MiB (3746MB), run=1315-13 15msec
Disk stats (read/write):
nvme0n1: ios=28593/0, sectors=7319808/0, merge=0/0, ticks=152167/0, in_queue=152168, util=85.88%
Jobs: 1 (f=1): [R(1)][10.0%][r=2749MiB/s][r=2749 IOPS][eta 00m:27s]
seqread: (groupid=0, jobs=1): err= 0: pid=5739: Fri Aug 7 06:18:12 2026
read: IOPS=2730, BW=2724MiB/s (2856MB/s)(6305MiB/2315msec)
slat (usec): min=10, max=423, avg=54.38, stdev=51.69
clat (usec): min=1274, max=18278, avg=5809.23, stdev=2437.97
lat (usec): min=1345, max=18348, avg=5863.63, stdev=2426.08
clat percentiles (usec):
| 1.00th=[ 1631], 5.00th=[ 2180], 10.00th=[ 2737], 20.00th=[ 3851],
| 30.00th=[ 4752], 40.00th=[ 5014], 50.00th=[ 5342], 60.00th=[ 5997],
| 70.00th=[ 6783], 80.00th=[ 7701], 90.00th=[ 8848], 95.00th=[10290],
| 99.00th=[13042], 99.50th=[14091], 99.90th=[15664], 99.95th=[16319],
| 99.99th=[18220]
bw ( MiB/s): min= 2698, max= 2764, per=100.00%, avg=2727.63, stdev=28.48, samples=4
iops : min= 2698, max= 2764, avg=2727.50, stdev=28.44, samples=4
lat (msec) : 2=3.65%, 4=17.56%, 10=72.78%, 20=5.76%
cpu : usr=0.78%, sys=15.08%, ctx=5692, majf=0, minf=526
IO depths : 1=0.1%, 2=0.1%, 4=0.1%, 8=0.1%, 16=99.8%, 32=0.0%, >=64=0.0%
submit : 0=0.0%, 4=100.0%, 8=0.0%, 16=0.0%, 32=0.0%, 64=0.0%, >=64=0.0%
complete : 0=0.0%, 4=100.0%, 8=0.0%, 16=0.0%, 32=0.0%, 64=0.0%, >=64=0.0%
issued rwts: total=6322,0,0,0 short=0,0,0,0 dropped=0,0,0,0
latency : target=0, window=0, percentile=100.00%, depth=16
Run status group 0 (all jobs):
READ: bw=2724MiB/s (2856MB/s), 2724MiB/s-2724MiB/s (2856MB/s-2856MB/s), io=6305MiB (6611MB), run=2315-23 15msec
Disk stats (read/write):
nvme0n1: ios=50446/0, sectors=12914176/0, merge=0/0, ticks=268784/0, in_queue=268784, util=87.16%
Jobs: 1 (f=1): [R(1)][13.3%][r=2725MiB/s][r=2725 IOPS][eta 00m:26s]
seqread: (groupid=0, jobs=1): err= 0: pid=5739: Fri Aug 7 06:18:13 2026
read: IOPS=2734, BW=2729MiB/s (2862MB/s)(9045MiB/3314msec)
slat (usec): min=10, max=1305, avg=54.28, stdev=52.94
clat (usec): min=1252, max=18278, avg=5800.20, stdev=2431.29
lat (usec): min=1328, max=18348, avg=5854.47, stdev=2419.25
clat percentiles (usec):
| 1.00th=[ 1647], 5.00th=[ 2147], 10.00th=[ 2704], 20.00th=[ 3851],
| 30.00th=[ 4752], 40.00th=[ 5014], 50.00th=[ 5342], 60.00th=[ 5997],
| 70.00th=[ 6783], 80.00th=[ 7635], 90.00th=[ 8848], 95.00th=[10421],
| 99.00th=[13042], 99.50th=[13960], 99.90th=[15533], 99.95th=[15926],
| 99.99th=[18220]
bw ( MiB/s): min= 2698, max= 2764, per=99.91%, avg=2726.76, stdev=24.58, samples=6
iops : min= 2698, max= 2764, avg=2726.67, stdev=24.55, samples=6
lat (msec) : 2=3.74%, 4=17.58%, 10=72.58%, 20=5.93%
cpu : usr=0.54%, sys=15.24%, ctx=8167, majf=0, minf=526
IO depths : 1=0.1%, 2=0.1%, 4=0.1%, 8=0.1%, 16=99.8%, 32=0.0%, >=64=0.0%
submit : 0=0.0%, 4=100.0%, 8=0.0%, 16=0.0%, 32=0.0%, 64=0.0%, >=64=0.0%
complete : 0=0.0%, 4=100.0%, 8=0.0%, 16=0.0%, 32=0.0%, 64=0.0%, >=64=0.0%
issued rwts: total=9062,0,0,0 short=0,0,0,0 dropped=0,0,0,0
latency : target=0, window=0, percentile=100.00%, depth=16
Run status group 0 (all jobs):
READ: bw=2729MiB/s (2862MB/s), 2729MiB/s-2729MiB/s (2862MB/s-2862MB/s), io=9045MiB (9484MB), run=3314-33 14msec
Disk stats (read/write):
nvme0n1: ios=72368/0, sectors=18526208/0, merge=0/0, ticks=384996/0, in_queue=384997, util=88.86%
Jobs: 1 (f=1): [R(1)][16.7%][r=2738MiB/s][r=2738 IOPS][eta 00m:25s]
seqread: (groupid=0, jobs=1): err= 0: pid=5739: Fri Aug 7 06:18:14 2026
read: IOPS=2728, BW=2724MiB/s (2857MB/s)(11.5GiB/4315msec)
slat (usec): min=10, max=1305, avg=54.32, stdev=52.15
clat (usec): min=1252, max=18278, avg=5812.07, stdev=2430.21
lat (usec): min=1328, max=18348, avg=5866.42, stdev=2418.55
clat percentiles (usec):
| 1.00th=[ 1647], 5.00th=[ 2147], 10.00th=[ 2737], 20.00th=[ 3884],
| 30.00th=[ 4752], 40.00th=[ 5014], 50.00th=[ 5342], 60.00th=[ 5997],
| 70.00th=[ 6718], 80.00th=[ 7635], 90.00th=[ 8848], 95.00th=[10421],
| 99.00th=[13042], 99.50th=[13960], 99.90th=[15664], 99.95th=[16450],
| 99.99th=[17695]
bw ( MiB/s): min= 2698, max= 2764, per=100.00%, avg=2729.57, stdev=21.42, samples=8
iops : min= 2698, max= 2764, avg=2729.50, stdev=21.40, samples=8
lat (msec) : 2=3.74%, 4=17.39%, 10=72.73%, 20=6.01%
cpu : usr=0.60%, sys=15.18%, ctx=10638, majf=0, minf=526
IO depths : 1=0.1%, 2=0.1%, 4=0.1%, 8=0.1%, 16=99.9%, 32=0.0%, >=64=0.0%
submit : 0=0.0%, 4=100.0%, 8=0.0%, 16=0.0%, 32=0.0%, 64=0.0%, >=64=0.0%
complete : 0=0.0%, 4=100.0%, 8=0.0%, 16=0.0%, 32=0.0%, 64=0.0%, >=64=0.0%
issued rwts: total=11773,0,0,0 short=0,0,0,0 dropped=0,0,0,0
latency : target=0, window=0, percentile=100.00%, depth=16
Run status group 0 (all jobs):
READ: bw=2724MiB/s (2857MB/s), 2724MiB/s-2724MiB/s (2857MB/s-2857MB/s), io=11.5GiB (12.3GB), run=4315-43 15msec
Disk stats (read/write):
nvme0n1: ios=94057/0, sectors=24078592/0, merge=0/0, ticks=501023/0, in_queue=501024, util=89.23%
Jobs: 1 (f=1): [R(1)][20.0%][r=2712MiB/s][r=2712 IOPS][eta 00m:24s]
seqread: (groupid=0, jobs=1): err= 0: pid=5739: Fri Aug 7 06:18:15 2026
read: IOPS=2727, BW=2724MiB/s (2857MB/s)(14.1GiB/5315msec)
slat (usec): min=10, max=1305, avg=54.42, stdev=51.70
clat (usec): min=1252, max=18278, avg=5810.04, stdev=2423.71
lat (usec): min=1328, max=18348, avg=5864.45, stdev=2412.00
clat percentiles (usec):
| 1.00th=[ 1647], 5.00th=[ 2147], 10.00th=[ 2737], 20.00th=[ 3851],
| 30.00th=[ 4752], 40.00th=[ 5014], 50.00th=[ 5342], 60.00th=[ 5997],
| 70.00th=[ 6783], 80.00th=[ 7635], 90.00th=[ 8848], 95.00th=[10290],
| 99.00th=[12911], 99.50th=[13960], 99.90th=[15664], 99.95th=[16319],
| 99.99th=[17695]
bw ( MiB/s): min= 2698, max= 2764, per=100.00%, avg=2726.05, stdev=21.06, samples=10
iops : min= 2698, max= 2764, avg=2726.00, stdev=21.04, samples=10
lat (msec) : 2=3.74%, 4=17.49%, 10=72.77%, 20=5.89%
cpu : usr=0.90%, sys=14.96%, ctx=13082, majf=0, minf=526
IO depths : 1=0.1%, 2=0.1%, 4=0.1%, 8=0.1%, 16=99.9%, 32=0.0%, >=64=0.0%
submit : 0=0.0%, 4=100.0%, 8=0.0%, 16=0.0%, 32=0.0%, 64=0.0%, >=64=0.0%
complete : 0=0.0%, 4=100.0%, 8=0.0%, 16=0.0%, 32=0.0%, 64=0.0%, >=64=0.0%
issued rwts: total=14497,0,0,0 short=0,0,0,0 dropped=0,0,0,0
latency : target=0, window=0, percentile=100.00%, depth=16
Run status group 0 (all jobs):
READ: bw=2724MiB/s (2857MB/s), 2724MiB/s-2724MiB/s (2857MB/s-2857MB/s), io=14.1GiB (15.2GB), run=5315-53 15msec
Disk stats (read/write):
nvme0n1: ios=115850/5, sectors=29657600/72, merge=0/4, ticks=616713/2, in_queue=616715, util=89.78%
Jobs: 1 (f=1): [R(1)][23.3%][r=2697MiB/s][r=2697 IOPS][eta 00m:23s]
seqread: (groupid=0, jobs=1): err= 0: pid=5739: Fri Aug 7 06:18:16 2026
read: IOPS=2720, BW=2718MiB/s (2850MB/s)(16.8GiB/6315msec)
slat (usec): min=10, max=1305, avg=54.44, stdev=51.66
clat (usec): min=1252, max=18278, avg=5826.26, stdev=2433.55
lat (usec): min=1328, max=18348, avg=5880.71, stdev=2421.87
clat percentiles (usec):
| 1.00th=[ 1647], 5.00th=[ 2147], 10.00th=[ 2737], 20.00th=[ 3884],
| 30.00th=[ 4752], 40.00th=[ 5014], 50.00th=[ 5407], 60.00th=[ 6063],
| 70.00th=[ 6783], 80.00th=[ 7701], 90.00th=[ 8979], 95.00th=[10421],
| 99.00th=[13042], 99.50th=[13960], 99.90th=[15664], 99.95th=[16319],
| 99.99th=[17957]
bw ( MiB/s): min= 2690, max= 2764, per=100.00%, avg=2721.71, stdev=22.00, samples=12
iops : min= 2690, max= 2764, avg=2721.67, stdev=21.97, samples=12
lat (msec) : 2=3.71%, 4=17.42%, 10=72.85%, 20=5.93%
cpu : usr=0.93%, sys=14.85%, ctx=15525, majf=0, minf=526
IO depths : 1=0.1%, 2=0.1%, 4=0.1%, 8=0.1%, 16=99.9%, 32=0.0%, >=64=0.0%
submit : 0=0.0%, 4=100.0%, 8=0.0%, 16=0.0%, 32=0.0%, 64=0.0%, >=64=0.0%
complete : 0=0.0%, 4=100.0%, 8=0.0%, 16=0.0%, 32=0.0%, 64=0.0%, >=64=0.0%
issued rwts: total=17181,0,0,0 short=0,0,0,0 dropped=0,0,0,0
latency : target=0, window=0, percentile=100.00%, depth=16
Run status group 0 (all jobs):
READ: bw=2718MiB/s (2850MB/s), 2718MiB/s-2718MiB/s (2850MB/s-2850MB/s), io=16.8GiB (18.0GB), run=6315-63 15msec
Disk stats (read/write):
nvme0n1: ios=137320/7, sectors=35153920/96, merge=0/5, ticks=733040/12, in_queue=733058, util=89.95%
Jobs: 1 (f=1): [R(1)][26.7%][r=2714MiB/s][r=2714 IOPS][eta 00m:22s]
seqread: (groupid=0, jobs=1): err= 0: pid=5739: Fri Aug 7 06:18:17 2026
read: IOPS=2722, BW=2720MiB/s (2853MB/s)(19.4GiB/7315msec)
slat (usec): min=10, max=1305, avg=54.17, stdev=51.31
clat (usec): min=1252, max=18278, avg=5822.34, stdev=2417.35
lat (usec): min=1328, max=18348, avg=5876.50, stdev=2405.81
clat percentiles (usec):
| 1.00th=[ 1647], 5.00th=[ 2180], 10.00th=[ 2737], 20.00th=[ 3884],
| 30.00th=[ 4752], 40.00th=[ 5014], 50.00th=[ 5407], 60.00th=[ 6063],
| 70.00th=[ 6783], 80.00th=[ 7701], 90.00th=[ 8848], 95.00th=[10290],
| 99.00th=[12911], 99.50th=[13829], 99.90th=[15664], 99.95th=[16057],
| 99.99th=[17695]
bw ( MiB/s): min= 2688, max= 2764, per=100.00%, avg=2721.04, stdev=23.28, samples=14
iops : min= 2688, max= 2764, avg=2721.00, stdev=23.25, samples=14
lat (msec) : 2=3.67%, 4=17.45%, 10=73.02%, 20=5.78%
cpu : usr=0.83%, sys=14.87%, ctx=18024, majf=0, minf=526
IO depths : 1=0.1%, 2=0.1%, 4=0.1%, 8=0.1%, 16=99.9%, 32=0.0%, >=64=0.0%
submit : 0=0.0%, 4=100.0%, 8=0.0%, 16=0.0%, 32=0.0%, 64=0.0%, >=64=0.0%
complete : 0=0.0%, 4=100.0%, 8=0.0%, 16=0.0%, 32=0.0%, 64=0.0%, >=64=0.0%
issued rwts: total=19917,0,0,0 short=0,0,0,0 dropped=0,0,0,0
latency : target=0, window=0, percentile=100.00%, depth=16
Run status group 0 (all jobs):
READ: bw=2720MiB/s (2853MB/s), 2720MiB/s-2720MiB/s (2853MB/s-2853MB/s), io=19.4GiB (20.9GB), run=7315-73 15msec
Disk stats (read/write):
nvme0n1: ios=159213/7, sectors=40758528/96, merge=0/5, ticks=849652/12, in_queue=849670, util=90.08%
Jobs: 1 (f=1): [R(1)][30.0%][r=2717MiB/s][r=2717 IOPS][eta 00m:21s]
seqread: (groupid=0, jobs=1): err= 0: pid=5739: Fri Aug 7 06:18:18 2026
read: IOPS=2720, BW=2718MiB/s (2850MB/s)(22.1GiB/8314msec)
slat (usec): min=10, max=1305, avg=54.09, stdev=51.27
clat (usec): min=1252, max=18278, avg=5827.64, stdev=2414.09
lat (usec): min=1328, max=18348, avg=5881.74, stdev=2402.47
clat percentiles (usec):
| 1.00th=[ 1647], 5.00th=[ 2180], 10.00th=[ 2769], 20.00th=[ 3884],
| 30.00th=[ 4752], 40.00th=[ 5014], 50.00th=[ 5407], 60.00th=[ 5997],
| 70.00th=[ 6783], 80.00th=[ 7701], 90.00th=[ 8848], 95.00th=[10290],
| 99.00th=[12911], 99.50th=[13829], 99.90th=[15664], 99.95th=[16188],
| 99.99th=[17695]
bw ( MiB/s): min= 2688, max= 2764, per=100.00%, avg=2720.53, stdev=22.80, samples=16
iops : min= 2688, max= 2764, avg=2720.50, stdev=22.77, samples=16
lat (msec) : 2=3.59%, 4=17.32%, 10=73.25%, 20=5.77%
cpu : usr=0.83%, sys=14.83%, ctx=20441, majf=0, minf=526
IO depths : 1=0.1%, 2=0.1%, 4=0.1%, 8=0.1%, 16=99.9%, 32=0.0%, >=64=0.0%
submit : 0=0.0%, 4=100.0%, 8=0.0%, 16=0.0%, 32=0.0%, 64=0.0%, >=64=0.0%
complete : 0=0.0%, 4=100.0%, 8=0.0%, 16=0.0%, 32=0.0%, 64=0.0%, >=64=0.0%
issued rwts: total=22616,0,0,0 short=0,0,0,0 dropped=0,0,0,0
latency : target=0, window=0, percentile=100.00%, depth=16
Run status group 0 (all jobs):
READ: bw=2718MiB/s (2850MB/s), 2718MiB/s-2718MiB/s (2850MB/s-2850MB/s), io=22.1GiB (23.7GB), run=8314-83 14msec
Disk stats (read/write):
nvme0n1: ios=180808/7, sectors=46286848/96, merge=0/5, ticks=966010/12, in_queue=966028, util=89.94%
Jobs: 1 (f=1): [R(1)][33.3%][r=2758MiB/s][r=2758 IOPS][eta 00m:20s]
seqread: (groupid=0, jobs=1): err= 0: pid=5739: Fri Aug 7 06:18:19 2026
read: IOPS=2724, BW=2723MiB/s (2855MB/s)(24.8GiB/9314msec)
slat (usec): min=10, max=1305, avg=54.15, stdev=51.23
clat (usec): min=1211, max=18278, avg=5817.59, stdev=2416.92
lat (usec): min=1275, max=18348, avg=5871.76, stdev=2405.43
clat percentiles (usec):
| 1.00th=[ 1647], 5.00th=[ 2180], 10.00th=[ 2769], 20.00th=[ 3884],
| 30.00th=[ 4752], 40.00th=[ 5014], 50.00th=[ 5342], 60.00th=[ 5997],
| 70.00th=[ 6783], 80.00th=[ 7635], 90.00th=[ 8848], 95.00th=[10290],
| 99.00th=[13042], 99.50th=[14091], 99.90th=[15795], 99.95th=[16450],
| 99.99th=[17695]
bw ( MiB/s): min= 2688, max= 2782, per=100.00%, avg=2724.73, stdev=25.96, samples=18
iops : min= 2688, max= 2782, avg=2724.67, stdev=25.93, samples=18
lat (msec) : 2=3.60%, 4=17.31%, 10=73.26%, 20=5.77%
cpu : usr=0.79%, sys=14.90%, ctx=22907, majf=0, minf=526
IO depths : 1=0.1%, 2=0.1%, 4=0.1%, 8=0.1%, 16=99.9%, 32=0.0%, >=64=0.0%
submit : 0=0.0%, 4=100.0%, 8=0.0%, 16=0.0%, 32=0.0%, 64=0.0%, >=64=0.0%
complete : 0=0.0%, 4=100.0%, 8=0.0%, 16=0.0%, 32=0.0%, 64=0.0%, >=64=0.0%
issued rwts: total=25378,0,0,0 short=0,0,0,0 dropped=0,0,0,0
latency : target=0, window=0, percentile=100.00%, depth=16
Run status group 0 (all jobs):
READ: bw=2723MiB/s (2855MB/s), 2723MiB/s-2723MiB/s (2855MB/s-2855MB/s), io=24.8GiB (26.6GB), run=9314-93 14msec
Disk stats (read/write):
nvme0n1: ios=202907/7, sectors=51944192/96, merge=0/5, ticks=1081849/12, in_queue=1081867, util=89.82%
Jobs: 1 (f=1): [R(1)][36.7%][r=2722MiB/s][r=2722 IOPS][eta 00m:19s]
seqread: (groupid=0, jobs=1): err= 0: pid=5739: Fri Aug 7 06:18:20 2026
read: IOPS=2724, BW=2723MiB/s (2855MB/s)(27.4GiB/10314msec)
slat (usec): min=10, max=1305, avg=54.34, stdev=51.46
clat (usec): min=1211, max=18278, avg=5818.28, stdev=2423.19
lat (usec): min=1275, max=18348, avg=5872.62, stdev=2411.58
clat percentiles (usec):
| 1.00th=[ 1647], 5.00th=[ 2180], 10.00th=[ 2769], 20.00th=[ 3884],
| 30.00th=[ 4752], 40.00th=[ 5014], 50.00th=[ 5342], 60.00th=[ 5997],
| 70.00th=[ 6783], 80.00th=[ 7635], 90.00th=[ 8848], 95.00th=[10290],
| 99.00th=[13173], 99.50th=[14091], 99.90th=[15926], 99.95th=[16450],
| 99.99th=[17695]
bw ( MiB/s): min= 2688, max= 2782, per=100.00%, avg=2724.75, stdev=24.91, samples=20
iops : min= 2688, max= 2782, avg=2724.70, stdev=24.89, samples=20
lat (msec) : 2=3.61%, 4=17.37%, 10=73.22%, 20=5.74%
cpu : usr=0.74%, sys=15.01%, ctx=25337, majf=0, minf=526
IO depths : 1=0.1%, 2=0.1%, 4=0.1%, 8=0.1%, 16=99.9%, 32=0.0%, >=64=0.0%
submit : 0=0.0%, 4=100.0%, 8=0.0%, 16=0.0%, 32=0.0%, 64=0.0%, >=64=0.0%
complete : 0=0.0%, 4=100.0%, 8=0.0%, 16=0.0%, 32=0.0%, 64=0.0%, >=64=0.0%
issued rwts: total=28099,0,0,0 short=0,0,0,0 dropped=0,0,0,0
latency : target=0, window=0, percentile=100.00%, depth=16
Run status group 0 (all jobs):
READ: bw=2723MiB/s (2855MB/s), 2723MiB/s-2723MiB/s (2855MB/s-2855MB/s), io=27.4GiB (29.4GB), run=10314-1 0314msec
Disk stats (read/write):
nvme0n1: ios=224654/7, sectors=57511424/96, merge=0/5, ticks=1197992/12, in_queue=1198010, util=90.12%
Jobs: 1 (f=1): [R(1)][40.0%][r=2741MiB/s][r=2741 IOPS][eta 00m:18s]
seqread: (groupid=0, jobs=1): err= 0: pid=5739: Fri Aug 7 06:18:21 2026
read: IOPS=2726, BW=2725MiB/s (2857MB/s)(30.1GiB/11315msec)
slat (usec): min=10, max=1305, avg=53.96, stdev=50.99
clat (usec): min=1211, max=18278, avg=5814.30, stdev=2414.66
lat (usec): min=1275, max=18348, avg=5868.27, stdev=2403.16
clat percentiles (usec):
| 1.00th=[ 1647], 5.00th=[ 2180], 10.00th=[ 2769], 20.00th=[ 3884],
| 30.00th=[ 4752], 40.00th=[ 5014], 50.00th=[ 5342], 60.00th=[ 5997],
| 70.00th=[ 6718], 80.00th=[ 7635], 90.00th=[ 8848], 95.00th=[10290],
| 99.00th=[13173], 99.50th=[14091], 99.90th=[15926], 99.95th=[16450],
| 99.99th=[17695]
bw ( MiB/s): min= 2688, max= 2782, per=100.00%, avg=2726.23, stdev=24.19, samples=22
iops : min= 2688, max= 2782, avg=2726.18, stdev=24.17, samples=22
lat (msec) : 2=3.61%, 4=17.31%, 10=73.33%, 20=5.70%
cpu : usr=0.72%, sys=14.94%, ctx=27857, majf=0, minf=526
IO depths : 1=0.1%, 2=0.1%, 4=0.1%, 8=0.1%, 16=100.0%, 32=0.0%, >=64=0.0%
submit : 0=0.0%, 4=100.0%, 8=0.0%, 16=0.0%, 32=0.0%, 64=0.0%, >=64=0.0%
complete : 0=0.0%, 4=100.0%, 8=0.0%, 16=0.0%, 32=0.0%, 64=0.0%, >=64=0.0%
issued rwts: total=30846,0,0,0 short=0,0,0,0 dropped=0,0,0,0
latency : target=0, window=0, percentile=100.00%, depth=16
Run status group 0 (all jobs):
READ: bw=2725MiB/s (2857MB/s), 2725MiB/s-2725MiB/s (2857MB/s-2857MB/s), io=30.1GiB (32.3GB), run=11315-1 1315msec
Disk stats (read/write):
nvme0n1: ios=246641/8, sectors=63140096/104, merge=0/5, ticks=1314694/13, in_queue=1314713, util=90.33%
Jobs: 1 (f=1): [R(1)][43.3%][r=2725MiB/s][r=2725 IOPS][eta 00m:17s]
seqread: (groupid=0, jobs=1): err= 0: pid=5739: Fri Aug 7 06:18:22 2026
read: IOPS=2726, BW=2725MiB/s (2858MB/s)(32.8GiB/12315msec)
slat (usec): min=10, max=1305, avg=53.94, stdev=50.91
clat (usec): min=1211, max=18278, avg=5812.68, stdev=2407.65
lat (usec): min=1275, max=18348, avg=5866.60, stdev=2396.08
clat percentiles (usec):
| 1.00th=[ 1647], 5.00th=[ 2180], 10.00th=[ 2769], 20.00th=[ 3916],
| 30.00th=[ 4752], 40.00th=[ 5014], 50.00th=[ 5342], 60.00th=[ 5997],
| 70.00th=[ 6718], 80.00th=[ 7635], 90.00th=[ 8848], 95.00th=[10290],
| 99.00th=[13042], 99.50th=[14091], 99.90th=[15926], 99.95th=[16450],
| 99.99th=[17695]
bw ( MiB/s): min= 2688, max= 2782, per=100.00%, avg=2726.38, stdev=23.19, samples=24
iops : min= 2688, max= 2782, avg=2726.33, stdev=23.17, samples=24
lat (msec) : 2=3.59%, 4=17.30%, 10=73.41%, 20=5.65%
cpu : usr=0.80%, sys=14.88%, ctx=30317, majf=0, minf=526
IO depths : 1=0.1%, 2=0.1%, 4=0.1%, 8=0.1%, 16=100.0%, 32=0.0%, >=64=0.0%
submit : 0=0.0%, 4=100.0%, 8=0.0%, 16=0.0%, 32=0.0%, 64=0.0%, >=64=0.0%
complete : 0=0.0%, 4=100.0%, 8=0.0%, 16=0.0%, 32=0.0%, 64=0.0%, >=64=0.0%
issued rwts: total=33581,0,0,0 short=0,0,0,0 dropped=0,0,0,0
latency : target=0, window=0, percentile=100.00%, depth=16
Run status group 0 (all jobs):
READ: bw=2725MiB/s (2858MB/s), 2725MiB/s-2725MiB/s (2858MB/s-2858MB/s), io=32.8GiB (35.2GB), run=12315-1 2315msec
Disk stats (read/write):
nvme0n1: ios=268514/8, sectors=68739584/104, merge=0/5, ticks=1430598/13, in_queue=1430616, util=90.34%
Jobs: 1 (f=1): [R(1)][46.7%][r=2729MiB/s][r=2729 IOPS][eta 00m:16s]
seqread: (groupid=0, jobs=1): err= 0: pid=5739: Fri Aug 7 06:18:23 2026
read: IOPS=2725, BW=2724MiB/s (2857MB/s)(35.4GiB/13314msec)
slat (usec): min=10, max=1305, avg=54.14, stdev=51.06
clat (usec): min=1162, max=18278, avg=5815.52, stdev=2414.41
lat (usec): min=1275, max=18348, avg=5869.67, stdev=2402.67
clat percentiles (usec):
| 1.00th=[ 1647], 5.00th=[ 2180], 10.00th=[ 2769], 20.00th=[ 3884],
| 30.00th=[ 4752], 40.00th=[ 5014], 50.00th=[ 5342], 60.00th=[ 5997],
| 70.00th=[ 6718], 80.00th=[ 7635], 90.00th=[ 8848], 95.00th=[10290],
| 99.00th=[13173], 99.50th=[14091], 99.90th=[15795], 99.95th=[16450],
| 99.99th=[17695]
bw ( MiB/s): min= 2688, max= 2782, per=100.00%, avg=2726.81, stdev=22.75, samples=26
iops : min= 2688, max= 2782, avg=2726.77, stdev=22.73, samples=26
lat (msec) : 2=3.56%, 4=17.40%, 10=73.25%, 20=5.76%
cpu : usr=0.75%, sys=14.97%, ctx=32762, majf=0, minf=526
IO depths : 1=0.1%, 2=0.1%, 4=0.1%, 8=0.1%, 16=100.0%, 32=0.0%, >=64=0.0%
submit : 0=0.0%, 4=100.0%, 8=0.0%, 16=0.0%, 32=0.0%, 64=0.0%, >=64=0.0%
complete : 0=0.0%, 4=100.0%, 8=0.0%, 16=0.0%, 32=0.0%, 64=0.0%, >=64=0.0%
issued rwts: total=36290,0,0,0 short=0,0,0,0 dropped=0,0,0,0
latency : target=0, window=0, percentile=100.00%, depth=16
Run status group 0 (all jobs):
READ: bw=2724MiB/s (2857MB/s), 2724MiB/s-2724MiB/s (2857MB/s-2857MB/s), io=35.4GiB (38.0GB), run=13314-1 3314msec
Disk stats (read/write):
nvme0n1: ios=290189/8, sectors=74288384/104, merge=0/5, ticks=1546969/13, in_queue=1546988, util=90.57%
Jobs: 1 (f=1): [R(1)][50.0%][r=2717MiB/s][r=2717 IOPS][eta 00m:15s]
seqread: (groupid=0, jobs=1): err= 0: pid=5739: Fri Aug 7 06:18:24 2026
read: IOPS=2725, BW=2724MiB/s (2856MB/s)(38.1GiB/14315msec)
slat (usec): min=10, max=1305, avg=54.05, stdev=51.01
clat (usec): min=1162, max=18435, avg=5816.05, stdev=2421.02
lat (usec): min=1275, max=18454, avg=5870.11, stdev=2409.37
clat percentiles (usec):
| 1.00th=[ 1647], 5.00th=[ 2180], 10.00th=[ 2769], 20.00th=[ 3884],
| 30.00th=[ 4752], 40.00th=[ 5014], 50.00th=[ 5342], 60.00th=[ 5997],
| 70.00th=[ 6718], 80.00th=[ 7635], 90.00th=[ 8848], 95.00th=[10290],
| 99.00th=[13173], 99.50th=[14091], 99.90th=[15926], 99.95th=[16581],
| 99.99th=[17695]
bw ( MiB/s): min= 2688, max= 2782, per=100.00%, avg=2726.11, stdev=22.04, samples=28
iops : min= 2688, max= 2782, avg=2726.07, stdev=22.03, samples=28
lat (msec) : 2=3.56%, 4=17.45%, 10=73.19%, 20=5.77%
cpu : usr=0.75%, sys=14.95%, ctx=35272, majf=0, minf=526
IO depths : 1=0.1%, 2=0.1%, 4=0.1%, 8=0.1%, 16=100.0%, 32=0.0%, >=64=0.0%
submit : 0=0.0%, 4=100.0%, 8=0.0%, 16=0.0%, 32=0.0%, 64=0.0%, >=64=0.0%
complete : 0=0.0%, 4=100.0%, 8=0.0%, 16=0.0%, 32=0.0%, 64=0.0%, >=64=0.0%
issued rwts: total=39011,0,0,0 short=0,0,0,0 dropped=0,0,0,0
latency : target=0, window=0, percentile=100.00%, depth=16
Run status group 0 (all jobs):
READ: bw=2724MiB/s (2856MB/s), 2724MiB/s-2724MiB/s (2856MB/s-2856MB/s), io=38.1GiB (40.9GB), run=14315-1 4315msec
Disk stats (read/write):
nvme0n1: ios=311963/8, sectors=79862528/104, merge=0/5, ticks=1663316/13, in_queue=1663334, util=90.67%
Jobs: 1 (f=1): [R(1)][53.3%][r=2721MiB/s][r=2721 IOPS][eta 00m:14s]
seqread: (groupid=0, jobs=1): err= 0: pid=5739: Fri Aug 7 06:18:25 2026
read: IOPS=2723, BW=2723MiB/s (2855MB/s)(40.7GiB/15315msec)
slat (usec): min=10, max=1305, avg=53.93, stdev=50.81
clat (usec): min=1162, max=18435, avg=5819.04, stdev=2425.23
lat (usec): min=1275, max=18454, avg=5872.98, stdev=2413.56
clat percentiles (usec):
| 1.00th=[ 1647], 5.00th=[ 2180], 10.00th=[ 2769], 20.00th=[ 3884],
| 30.00th=[ 4752], 40.00th=[ 5014], 50.00th=[ 5342], 60.00th=[ 5997],
| 70.00th=[ 6718], 80.00th=[ 7635], 90.00th=[ 8848], 95.00th=[10290],
| 99.00th=[13173], 99.50th=[14091], 99.90th=[16057], 99.95th=[16581],
| 99.99th=[17695]
bw ( MiB/s): min= 2688, max= 2782, per=100.00%, avg=2725.79, stdev=21.35, samples=30
iops : min= 2688, max= 2782, avg=2725.73, stdev=21.33, samples=30
lat (msec) : 2=3.57%, 4=17.45%, 10=73.11%, 20=5.83%
cpu : usr=0.84%, sys=14.82%, ctx=37726, majf=0, minf=526
IO depths : 1=0.1%, 2=0.1%, 4=0.1%, 8=0.1%, 16=100.0%, 32=0.0%, >=64=0.0%
submit : 0=0.0%, 4=100.0%, 8=0.0%, 16=0.0%, 32=0.0%, 64=0.0%, >=64=0.0%
complete : 0=0.0%, 4=100.0%, 8=0.0%, 16=0.0%, 32=0.0%, 64=0.0%, >=64=0.0%
issued rwts: total=41717,0,0,0 short=0,0,0,0 dropped=0,0,0,0
latency : target=0, window=0, percentile=100.00%, depth=16
Run status group 0 (all jobs):
READ: bw=2723MiB/s (2855MB/s), 2723MiB/s-2723MiB/s (2855MB/s-2855MB/s), io=40.7GiB (43.7GB), run=15315-1 5315msec
Disk stats (read/write):
nvme0n1: ios=333603/8, sectors=85402368/104, merge=0/5, ticks=1779331/13, in_queue=1779350, util=90.46%
Jobs: 1 (f=1): [R(1)][56.7%][r=2719MiB/s][r=2719 IOPS][eta 00m:13s]
seqread: (groupid=0, jobs=1): err= 0: pid=5739: Fri Aug 7 06:18:26 2026
read: IOPS=2725, BW=2724MiB/s (2857MB/s)(43.4GiB/16315msec)
slat (usec): min=10, max=1305, avg=53.96, stdev=50.76
clat (usec): min=1162, max=18435, avg=5815.16, stdev=2428.61
lat (usec): min=1275, max=18454, avg=5869.13, stdev=2417.01
clat percentiles (usec):
| 1.00th=[ 1647], 5.00th=[ 2180], 10.00th=[ 2769], 20.00th=[ 3851],
| 30.00th=[ 4752], 40.00th=[ 5014], 50.00th=[ 5342], 60.00th=[ 5997],
| 70.00th=[ 6718], 80.00th=[ 7635], 90.00th=[ 8848], 95.00th=[10290],
| 99.00th=[13173], 99.50th=[14091], 99.90th=[16057], 99.95th=[16581],
| 99.99th=[17695]
bw ( MiB/s): min= 2688, max= 2782, per=100.00%, avg=2725.36, stdev=20.90, samples=32
iops : min= 2688, max= 2782, avg=2725.31, stdev=20.89, samples=32
lat (msec) : 2=3.58%, 4=17.65%, 10=72.90%, 20=5.84%
cpu : usr=0.79%, sys=14.89%, ctx=40193, majf=0, minf=526
IO depths : 1=0.1%, 2=0.1%, 4=0.1%, 8=0.1%, 16=100.0%, 32=0.0%, >=64=0.0%
submit : 0=0.0%, 4=100.0%, 8=0.0%, 16=0.0%, 32=0.0%, 64=0.0%, >=64=0.0%
complete : 0=0.0%, 4=100.0%, 8=0.0%, 16=0.0%, 32=0.0%, 64=0.0%, >=64=0.0%
issued rwts: total=44467,0,0,0 short=0,0,0,0 dropped=0,0,0,0
latency : target=0, window=0, percentile=100.00%, depth=16
Run status group 0 (all jobs):
READ: bw=2724MiB/s (2857MB/s), 2724MiB/s-2724MiB/s (2857MB/s-2857MB/s), io=43.4GiB (46.6GB), run=16315-1 6315msec
Disk stats (read/write):
nvme0n1: ios=355607/8, sectors=91035392/104, merge=0/5, ticks=1895020/13, in_queue=1895038, util=90.39%
Jobs: 1 (f=1): [R(1)][60.0%][r=2754MiB/s][r=2754 IOPS][eta 00m:12s]
seqread: (groupid=0, jobs=1): err= 0: pid=5739: Fri Aug 7 06:18:27 2026
read: IOPS=2724, BW=2724MiB/s (2856MB/s)(46.1GiB/17315msec)
slat (usec): min=10, max=1305, avg=54.04, stdev=50.90
clat (usec): min=1162, max=18435, avg=5816.50, stdev=2429.82
lat (usec): min=1275, max=18454, avg=5870.55, stdev=2418.19
clat percentiles (usec):
| 1.00th=[ 1647], 5.00th=[ 2180], 10.00th=[ 2769], 20.00th=[ 3884],
| 30.00th=[ 4752], 40.00th=[ 5014], 50.00th=[ 5342], 60.00th=[ 5997],
| 70.00th=[ 6718], 80.00th=[ 7635], 90.00th=[ 8848], 95.00th=[10290],
| 99.00th=[13173], 99.50th=[14091], 99.90th=[16057], 99.95th=[16581],
| 99.99th=[17695]
bw ( MiB/s): min= 2688, max= 2782, per=100.00%, avg=2727.05, stdev=21.41, samples=34
iops : min= 2688, max= 2782, avg=2727.00, stdev=21.40, samples=34
lat (msec) : 2=3.58%, 4=17.61%, 10=72.89%, 20=5.88%
cpu : usr=0.83%, sys=14.85%, ctx=42629, majf=0, minf=526
IO depths : 1=0.1%, 2=0.1%, 4=0.1%, 8=0.1%, 16=100.0%, 32=0.0%, >=64=0.0%
submit : 0=0.0%, 4=100.0%, 8=0.0%, 16=0.0%, 32=0.0%, 64=0.0%, >=64=0.0%
complete : 0=0.0%, 4=100.0%, 8=0.0%, 16=0.0%, 32=0.0%, 64=0.0%, >=64=0.0%
issued rwts: total=47178,0,0,0 short=0,0,0,0 dropped=0,0,0,0
latency : target=0, window=0, percentile=100.00%, depth=16
Run status group 0 (all jobs):
READ: bw=2724MiB/s (2856MB/s), 2724MiB/s-2724MiB/s (2856MB/s-2856MB/s), io=46.1GiB (49.5GB), run=17315-1 7315msec
Disk stats (read/write):
nvme0n1: ios=377314/8, sectors=96592384/104, merge=0/5, ticks=2011096/13, in_queue=2011114, util=90.47%
Jobs: 1 (f=1): [R(1)][63.3%][r=2703MiB/s][r=2703 IOPS][eta 00m:11s]
seqread: (groupid=0, jobs=1): err= 0: pid=5739: Fri Aug 7 06:18:28 2026
read: IOPS=2724, BW=2724MiB/s (2856MB/s)(48.7GiB/18315msec)
slat (usec): min=10, max=1305, avg=54.17, stdev=50.82
clat (usec): min=1162, max=18887, avg=5816.74, stdev=2436.93
lat (usec): min=1275, max=18928, avg=5870.90, stdev=2425.36
clat percentiles (usec):
| 1.00th=[ 1647], 5.00th=[ 2180], 10.00th=[ 2737], 20.00th=[ 3851],
| 30.00th=[ 4752], 40.00th=[ 5014], 50.00th=[ 5342], 60.00th=[ 5997],
| 70.00th=[ 6718], 80.00th=[ 7635], 90.00th=[ 8979], 95.00th=[10290],
| 99.00th=[13173], 99.50th=[14222], 99.90th=[16188], 99.95th=[16909],
| 99.99th=[17957]
bw ( MiB/s): min= 2678, max= 2782, per=100.00%, avg=2725.73, stdev=22.30, samples=36
iops : min= 2678, max= 2782, avg=2725.67, stdev=22.32, samples=36
lat (msec) : 2=3.59%, 4=17.70%, 10=72.77%, 20=5.90%
cpu : usr=0.88%, sys=14.85%, ctx=45057, majf=0, minf=526
IO depths : 1=0.1%, 2=0.1%, 4=0.1%, 8=0.1%, 16=100.0%, 32=0.0%, >=64=0.0%
submit : 0=0.0%, 4=100.0%, 8=0.0%, 16=0.0%, 32=0.0%, 64=0.0%, >=64=0.0%
complete : 0=0.0%, 4=100.0%, 8=0.0%, 16=0.0%, 32=0.0%, 64=0.0%, >=64=0.0%
issued rwts: total=49904,0,0,0 short=0,0,0,0 dropped=0,0,0,0
latency : target=0, window=0, percentile=100.00%, depth=16
Run status group 0 (all jobs):
READ: bw=2724MiB/s (2856MB/s), 2724MiB/s-2724MiB/s (2856MB/s-2856MB/s), io=48.7GiB (52.3GB), run=18315-1 8315msec
Disk stats (read/write):
nvme0n1: ios=399108/8, sectors=102171648/104, merge=0/5, ticks=2126671/13, in_queue=2126689, util=90.52%
Jobs: 1 (f=1): [R(1)][66.7%][r=2717MiB/s][r=2717 IOPS][eta 00m:10s]
seqread: (groupid=0, jobs=1): err= 0: pid=5739: Fri Aug 7 06:18:29 2026
read: IOPS=2723, BW=2723MiB/s (2855MB/s)(51.4GiB/19315msec)
slat (usec): min=10, max=1305, avg=54.16, stdev=50.76
clat (usec): min=1162, max=18887, avg=5818.47, stdev=2434.64
lat (usec): min=1275, max=18928, avg=5872.62, stdev=2423.06
clat percentiles (usec):
| 1.00th=[ 1647], 5.00th=[ 2180], 10.00th=[ 2737], 20.00th=[ 3851],
| 30.00th=[ 4752], 40.00th=[ 5014], 50.00th=[ 5342], 60.00th=[ 5997],
| 70.00th=[ 6718], 80.00th=[ 7635], 90.00th=[ 8979], 95.00th=[10290],
| 99.00th=[13173], 99.50th=[14222], 99.90th=[16057], 99.95th=[16581],
| 99.99th=[17695]
bw ( MiB/s): min= 2678, max= 2782, per=100.00%, avg=2725.27, stdev=21.99, samples=38
iops : min= 2678, max= 2782, avg=2725.21, stdev=22.01, samples=38
lat (msec) : 2=3.60%, 4=17.64%, 10=72.84%, 20=5.90%
cpu : usr=0.90%, sys=14.82%, ctx=47526, majf=0, minf=526
IO depths : 1=0.1%, 2=0.1%, 4=0.1%, 8=0.1%, 16=100.0%, 32=0.0%, >=64=0.0%
submit : 0=0.0%, 4=100.0%, 8=0.0%, 16=0.0%, 32=0.0%, 64=0.0%, >=64=0.0%
complete : 0=0.0%, 4=100.0%, 8=0.0%, 16=0.0%, 32=0.0%, 64=0.0%, >=64=0.0%
issued rwts: total=52614,0,0,0 short=0,0,0,0 dropped=0,0,0,0
latency : target=0, window=0, percentile=100.00%, depth=16
Run status group 0 (all jobs):
READ: bw=2723MiB/s (2855MB/s), 2723MiB/s-2723MiB/s (2855MB/s-2855MB/s), io=51.4GiB (55.2GB), run=19315-1 9315msec
Disk stats (read/write):
nvme0n1: ios=420782/8, sectors=107720192/104, merge=0/5, ticks=2243051/13, in_queue=2243069, util=90.60%
Jobs: 1 (f=1): [R(1)][70.0%][r=2738MiB/s][r=2738 IOPS][eta 00m:09s]
seqread: (groupid=0, jobs=1): err= 0: pid=5739: Fri Aug 7 06:18:30 2026
read: IOPS=2724, BW=2724MiB/s (2856MB/s)(54.0GiB/20315msec)
slat (usec): min=10, max=1305, avg=54.02, stdev=50.61
clat (usec): min=1162, max=18887, avg=5817.31, stdev=2435.96
lat (usec): min=1275, max=18928, avg=5871.33, stdev=2424.46
clat percentiles (usec):
| 1.00th=[ 1647], 5.00th=[ 2180], 10.00th=[ 2769], 20.00th=[ 3884],
| 30.00th=[ 4752], 40.00th=[ 5014], 50.00th=[ 5342], 60.00th=[ 5997],
| 70.00th=[ 6718], 80.00th=[ 7635], 90.00th=[ 8979], 95.00th=[10290],
| 99.00th=[13304], 99.50th=[14222], 99.90th=[16319], 99.95th=[16909],
| 99.99th=[17957]
bw ( MiB/s): min= 2678, max= 2782, per=100.00%, avg=2725.91, stdev=21.83, samples=40
iops : min= 2678, max= 2782, avg=2725.85, stdev=21.85, samples=40
lat (msec) : 2=3.57%, 4=17.58%, 10=72.92%, 20=5.90%
cpu : usr=0.89%, sys=14.79%, ctx=50023, majf=0, minf=526
IO depths : 1=0.1%, 2=0.1%, 4=0.1%, 8=0.1%, 16=100.0%, 32=0.0%, >=64=0.0%
submit : 0=0.0%, 4=100.0%, 8=0.0%, 16=0.0%, 32=0.0%, 64=0.0%, >=64=0.0%
complete : 0=0.0%, 4=100.0%, 8=0.0%, 16=0.0%, 32=0.0%, 64=0.0%, >=64=0.0%
issued rwts: total=55345,0,0,0 short=0,0,0,0 dropped=0,0,0,0
latency : target=0, window=0, percentile=100.00%, depth=16
Run status group 0 (all jobs):
READ: bw=2724MiB/s (2856MB/s), 2724MiB/s-2724MiB/s (2856MB/s-2856MB/s), io=54.0GiB (58.0GB), run=20315-2 0315msec
Disk stats (read/write):
nvme0n1: ios=442639/8, sectors=113315584/104, merge=0/5, ticks=2359180/13, in_queue=2359199, util=90.73%
Jobs: 1 (f=1): [R(1)][73.3%][r=2697MiB/s][r=2697 IOPS][eta 00m:08s]
seqread: (groupid=0, jobs=1): err= 0: pid=5739: Fri Aug 7 06:18:31 2026
read: IOPS=2723, BW=2722MiB/s (2855MB/s)(56.7GiB/21315msec)
slat (usec): min=10, max=1305, avg=53.92, stdev=50.63
clat (usec): min=1162, max=18887, avg=5820.53, stdev=2438.43
lat (usec): min=1275, max=18928, avg=5874.45, stdev=2426.92
clat percentiles (usec):
| 1.00th=[ 1647], 5.00th=[ 2180], 10.00th=[ 2769], 20.00th=[ 3884],
| 30.00th=[ 4752], 40.00th=[ 5014], 50.00th=[ 5342], 60.00th=[ 5997],
| 70.00th=[ 6718], 80.00th=[ 7635], 90.00th=[ 8979], 95.00th=[10421],
| 99.00th=[13304], 99.50th=[14222], 99.90th=[16319], 99.95th=[16909],
| 99.99th=[17957]
bw ( MiB/s): min= 2670, max= 2782, per=100.00%, avg=2724.53, stdev=22.97, samples=42
iops : min= 2670, max= 2782, avg=2724.48, stdev=22.99, samples=42
lat (msec) : 2=3.54%, 4=17.52%, 10=72.97%, 20=5.94%
cpu : usr=0.89%, sys=14.75%, ctx=52466, majf=0, minf=526
IO depths : 1=0.1%, 2=0.1%, 4=0.1%, 8=0.1%, 16=100.0%, 32=0.0%, >=64=0.0%
submit : 0=0.0%, 4=100.0%, 8=0.0%, 16=0.0%, 32=0.0%, 64=0.0%, >=64=0.0%
complete : 0=0.0%, 4=100.0%, 8=0.0%, 16=0.0%, 32=0.0%, 64=0.0%, >=64=0.0%
issued rwts: total=58045,0,0,0 short=0,0,0,0 dropped=0,0,0,0
latency : target=0, window=0, percentile=100.00%, depth=16
Run status group 0 (all jobs):
READ: bw=2722MiB/s (2855MB/s), 2722MiB/s-2722MiB/s (2855MB/s-2855MB/s), io=56.7GiB (60.8GB), run=21315-2 1315msec
Disk stats (read/write):
nvme0n1: ios=464219/8, sectors=118840064/104, merge=0/5, ticks=2475624/13, in_queue=2475642, util=90.81%
Jobs: 1 (f=1): [R(1)][79.3%][r=2744MiB/s][r=2744 IOPS][eta 00m:06s]
seqread: (groupid=0, jobs=1): err= 0: pid=5739: Fri Aug 7 06:18:32 2026
read: IOPS=2723, BW=2723MiB/s (2855MB/s)(59.3GiB/22314msec)
slat (usec): min=10, max=1305, avg=53.91, stdev=50.64
clat (usec): min=1162, max=18887, avg=5819.10, stdev=2439.83
lat (usec): min=1275, max=18928, avg=5873.02, stdev=2428.30
clat percentiles (usec):
| 1.00th=[ 1647], 5.00th=[ 2180], 10.00th=[ 2769], 20.00th=[ 3884],
| 30.00th=[ 4752], 40.00th=[ 5014], 50.00th=[ 5342], 60.00th=[ 5997],
| 70.00th=[ 6718], 80.00th=[ 7635], 90.00th=[ 8979], 95.00th=[10421],
| 99.00th=[13304], 99.50th=[14222], 99.90th=[16319], 99.95th=[16909],
| 99.99th=[17695]
bw ( MiB/s): min= 2670, max= 2784, per=100.00%, avg=2725.55, stdev=24.27, samples=44
iops : min= 2670, max= 2784, avg=2725.50, stdev=24.29, samples=44
lat (msec) : 2=3.52%, 4=17.60%, 10=72.91%, 20=5.94%
cpu : usr=0.90%, sys=14.74%, ctx=54925, majf=0, minf=526
IO depths : 1=0.1%, 2=0.1%, 4=0.1%, 8=0.1%, 16=100.0%, 32=0.0%, >=64=0.0%
submit : 0=0.0%, 4=100.0%, 8=0.0%, 16=0.0%, 32=0.0%, 64=0.0%, >=64=0.0%
complete : 0=0.0%, 4=100.0%, 8=0.0%, 16=0.0%, 32=0.0%, 64=0.0%, >=64=0.0%
issued rwts: total=60779,0,0,0 short=0,0,0,0 dropped=0,0,0,0
latency : target=0, window=0, percentile=100.00%, depth=16
Run status group 0 (all jobs):
READ: bw=2723MiB/s (2855MB/s), 2723MiB/s-2723MiB/s (2855MB/s-2855MB/s), io=59.3GiB (63.7GB), run=22314-2 2314msec
Disk stats (read/write):
nvme0n1: ios=486108/8, sectors=124443648/104, merge=0/5, ticks=2591559/13, in_queue=2591578, util=90.93%
Jobs: 1 (f=1): [R(1)][80.0%][r=2691MiB/s][r=2691 IOPS][eta 00m:06s]
seqread: (groupid=0, jobs=1): err= 0: pid=5739: Fri Aug 7 06:18:33 2026
read: IOPS=2722, BW=2722MiB/s (2854MB/s)(62.0GiB/23315msec)
slat (usec): min=10, max=1305, avg=53.92, stdev=50.68
clat (usec): min=1162, max=18887, avg=5821.31, stdev=2439.41
lat (usec): min=1275, max=18928, avg=5875.23, stdev=2427.84
clat percentiles (usec):
| 1.00th=[ 1647], 5.00th=[ 2180], 10.00th=[ 2769], 20.00th=[ 3884],
| 30.00th=[ 4752], 40.00th=[ 5014], 50.00th=[ 5342], 60.00th=[ 5997],
| 70.00th=[ 6718], 80.00th=[ 7635], 90.00th=[ 8979], 95.00th=[10421],
| 99.00th=[13304], 99.50th=[14222], 99.90th=[16319], 99.95th=[16909],
| 99.99th=[17695]
bw ( MiB/s): min= 2664, max= 2784, per=100.00%, avg=2724.05, stdev=25.42, samples=46
iops : min= 2664, max= 2784, avg=2724.00, stdev=25.43, samples=46
lat (msec) : 2=3.51%, 4=17.52%, 10=72.99%, 20=5.95%
cpu : usr=0.88%, sys=14.76%, ctx=57392, majf=0, minf=526
IO depths : 1=0.1%, 2=0.1%, 4=0.1%, 8=0.1%, 16=100.0%, 32=0.0%, >=64=0.0%
submit : 0=0.0%, 4=100.0%, 8=0.0%, 16=0.0%, 32=0.0%, 64=0.0%, >=64=0.0%
complete : 0=0.0%, 4=100.0%, 8=0.0%, 16=0.0%, 32=0.0%, 64=0.0%, >=64=0.0%
issued rwts: total=63479,0,0,0 short=0,0,0,0 dropped=0,0,0,0
latency : target=0, window=0, percentile=100.00%, depth=16
Run status group 0 (all jobs):
READ: bw=2722MiB/s (2854MB/s), 2722MiB/s-2722MiB/s (2854MB/s-2854MB/s), io=62.0GiB (66.5GB), run=23315-2 3315msec
Disk stats (read/write):
nvme0n1: ios=507698/8, sectors=129970688/104, merge=0/5, ticks=2707813/13, in_queue=2707831, util=91.06%
Jobs: 1 (f=1): [R(1)][83.3%][r=2706MiB/s][r=2706 IOPS][eta 00m:05s]
seqread: (groupid=0, jobs=1): err= 0: pid=5739: Fri Aug 7 06:18:34 2026
read: IOPS=2721, BW=2721MiB/s (2853MB/s)(64.6GiB/24315msec)
slat (usec): min=10, max=1305, avg=53.84, stdev=50.64
clat (usec): min=1162, max=18887, avg=5824.25, stdev=2440.63
lat (usec): min=1275, max=18928, avg=5878.09, stdev=2429.06
clat percentiles (usec):
| 1.00th=[ 1647], 5.00th=[ 2180], 10.00th=[ 2769], 20.00th=[ 3884],
| 30.00th=[ 4752], 40.00th=[ 5014], 50.00th=[ 5342], 60.00th=[ 5997],
| 70.00th=[ 6718], 80.00th=[ 7635], 90.00th=[ 8979], 95.00th=[10421],
| 99.00th=[13304], 99.50th=[14222], 99.90th=[16319], 99.95th=[16909],
| 99.99th=[17695]
bw ( MiB/s): min= 2664, max= 2784, per=100.00%, avg=2723.30, stdev=25.22, samples=48
iops : min= 2664, max= 2784, avg=2723.25, stdev=25.24, samples=48
lat (msec) : 2=3.50%, 4=17.52%, 10=72.97%, 20=5.99%
cpu : usr=0.87%, sys=14.75%, ctx=59827, majf=0, minf=526
IO depths : 1=0.1%, 2=0.1%, 4=0.1%, 8=0.1%, 16=100.0%, 32=0.0%, >=64=0.0%
submit : 0=0.0%, 4=100.0%, 8=0.0%, 16=0.0%, 32=0.0%, 64=0.0%, >=64=0.0%
complete : 0=0.0%, 4=100.0%, 8=0.0%, 16=0.0%, 32=0.0%, 64=0.0%, >=64=0.0%
issued rwts: total=66168,0,0,0 short=0,0,0,0 dropped=0,0,0,0
latency : target=0, window=0, percentile=100.00%, depth=16
Run status group 0 (all jobs):
READ: bw=2721MiB/s (2853MB/s), 2721MiB/s-2721MiB/s (2853MB/s-2853MB/s), io=64.6GiB (69.4GB), run=24315-2 4315msec
Disk stats (read/write):
nvme0n1: ios=529209/8, sectors=135477504/104, merge=0/5, ticks=2824237/13, in_queue=2824255, util=91.11%
Jobs: 1 (f=1): [R(1)][86.7%][r=2727MiB/s][r=2727 IOPS][eta 00m:04s]
seqread: (groupid=0, jobs=1): err= 0: pid=5739: Fri Aug 7 06:18:35 2026
read: IOPS=2722, BW=2722MiB/s (2854MB/s)(67.3GiB/25314msec)
slat (usec): min=10, max=1305, avg=53.82, stdev=50.61
clat (usec): min=1162, max=18887, avg=5821.74, stdev=2434.85
lat (usec): min=1275, max=18928, avg=5875.56, stdev=2423.26
clat percentiles (usec):
| 1.00th=[ 1647], 5.00th=[ 2180], 10.00th=[ 2769], 20.00th=[ 3884],
| 30.00th=[ 4752], 40.00th=[ 5014], 50.00th=[ 5342], 60.00th=[ 5997],
| 70.00th=[ 6718], 80.00th=[ 7635], 90.00th=[ 8979], 95.00th=[10421],
| 99.00th=[13304], 99.50th=[14222], 99.90th=[16319], 99.95th=[16712],
| 99.99th=[17695]
bw ( MiB/s): min= 2664, max= 2784, per=100.00%, avg=2723.57, stdev=25.29, samples=50
iops : min= 2664, max= 2784, avg=2723.52, stdev=25.30, samples=50
lat (msec) : 2=3.50%, 4=17.49%, 10=73.03%, 20=5.95%
cpu : usr=0.94%, sys=14.67%, ctx=62320, majf=0, minf=526
IO depths : 1=0.1%, 2=0.1%, 4=0.1%, 8=0.1%, 16=100.0%, 32=0.0%, >=64=0.0%
submit : 0=0.0%, 4=100.0%, 8=0.0%, 16=0.0%, 32=0.0%, 64=0.0%, >=64=0.0%
complete : 0=0.0%, 4=100.0%, 8=0.0%, 16=0.0%, 32=0.0%, 64=0.0%, >=64=0.0%
issued rwts: total=68920,0,0,0 short=0,0,0,0 dropped=0,0,0,0
latency : target=0, window=0, percentile=100.00%, depth=16
Run status group 0 (all jobs):
READ: bw=2722MiB/s (2854MB/s), 2722MiB/s-2722MiB/s (2854MB/s-2854MB/s), io=67.3GiB (72.2GB), run=25314-2 5314msec
Disk stats (read/write):
nvme0n1: ios=551231/8, sectors=141115136/104, merge=0/5, ticks=2940395/13, in_queue=2940414, util=91.19%
Jobs: 1 (f=1): [R(1)][90.0%][r=2716MiB/s][r=2716 IOPS][eta 00m:03s]
seqread: (groupid=0, jobs=1): err= 0: pid=5739: Fri Aug 7 06:18:36 2026
read: IOPS=2721, BW=2721MiB/s (2853MB/s)(69.9GiB/26315msec)
slat (usec): min=10, max=1305, avg=53.66, stdev=50.42
clat (usec): min=1162, max=18887, avg=5823.60, stdev=2432.32
lat (usec): min=1275, max=18928, avg=5877.27, stdev=2420.79
clat percentiles (usec):
| 1.00th=[ 1647], 5.00th=[ 2180], 10.00th=[ 2769], 20.00th=[ 3916],
| 30.00th=[ 4752], 40.00th=[ 5014], 50.00th=[ 5342], 60.00th=[ 5997],
| 70.00th=[ 6718], 80.00th=[ 7635], 90.00th=[ 8979], 95.00th=[10290],
| 99.00th=[13304], 99.50th=[14222], 99.90th=[16319], 99.95th=[16909],
| 99.99th=[17957]
bw ( MiB/s): min= 2664, max= 2784, per=100.00%, avg=2723.28, stdev=25.09, samples=52
iops : min= 2664, max= 2784, avg=2723.23, stdev=25.10, samples=52
lat (msec) : 2=3.49%, 4=17.41%, 10=73.17%, 20=5.92%
cpu : usr=0.91%, sys=14.65%, ctx=64819, majf=0, minf=526
IO depths : 1=0.1%, 2=0.1%, 4=0.1%, 8=0.1%, 16=100.0%, 32=0.0%, >=64=0.0%
submit : 0=0.0%, 4=100.0%, 8=0.0%, 16=0.0%, 32=0.0%, 64=0.0%, >=64=0.0%
complete : 0=0.0%, 4=100.0%, 8=0.0%, 16=0.0%, 32=0.0%, 64=0.0%, >=64=0.0%
issued rwts: total=71623,0,0,0 short=0,0,0,0 dropped=0,0,0,0
latency : target=0, window=0, percentile=100.00%, depth=16
Run status group 0 (all jobs):
READ: bw=2721MiB/s (2853MB/s), 2721MiB/s-2721MiB/s (2853MB/s-2853MB/s), io=69.9GiB (75.1GB), run=26315-2 6315msec
Disk stats (read/write):
nvme0n1: ios=572859/8, sectors=146651904/104, merge=0/5, ticks=3057169/13, in_queue=3057187, util=91.29%
Jobs: 1 (f=1): [R(1)][93.3%][r=2723MiB/s][r=2723 IOPS][eta 00m:02s]
seqread: (groupid=0, jobs=1): err= 0: pid=5739: Fri Aug 7 06:18:37 2026
read: IOPS=2721, BW=2721MiB/s (2853MB/s)(72.6GiB/27315msec)
slat (usec): min=10, max=1305, avg=53.58, stdev=50.37
clat (usec): min=1162, max=18887, avg=5824.15, stdev=2429.21
lat (usec): min=1275, max=18928, avg=5877.73, stdev=2417.69
clat percentiles (usec):
| 1.00th=[ 1647], 5.00th=[ 2180], 10.00th=[ 2769], 20.00th=[ 3916],
| 30.00th=[ 4752], 40.00th=[ 5014], 50.00th=[ 5342], 60.00th=[ 5997],
| 70.00th=[ 6718], 80.00th=[ 7635], 90.00th=[ 8848], 95.00th=[10290],
| 99.00th=[13304], 99.50th=[14222], 99.90th=[16319], 99.95th=[16909],
| 99.99th=[17957]
bw ( MiB/s): min= 2664, max= 2784, per=100.00%, avg=2723.27, stdev=24.62, samples=54
iops : min= 2664, max= 2784, avg=2723.22, stdev=24.63, samples=54
lat (msec) : 2=3.48%, 4=17.34%, 10=73.25%, 20=5.91%
cpu : usr=0.91%, sys=14.63%, ctx=67314, majf=0, minf=526
IO depths : 1=0.1%, 2=0.1%, 4=0.1%, 8=0.1%, 16=100.0%, 32=0.0%, >=64=0.0%
submit : 0=0.0%, 4=100.0%, 8=0.0%, 16=0.0%, 32=0.0%, 64=0.0%, >=64=0.0%
complete : 0=0.0%, 4=100.0%, 8=0.0%, 16=0.0%, 32=0.0%, 64=0.0%, >=64=0.0%
issued rwts: total=74337,0,0,0 short=0,0,0,0 dropped=0,0,0,0
latency : target=0, window=0, percentile=100.00%, depth=16
Run status group 0 (all jobs):
READ: bw=2721MiB/s (2853MB/s), 2721MiB/s-2721MiB/s (2853MB/s-2853MB/s), io=72.6GiB (77.9GB), run=27315-2 7315msec
Disk stats (read/write):
nvme0n1: ios=594574/8, sectors=152211200/104, merge=0/5, ticks=3173572/13, in_queue=3173591, util=91.31%
Jobs: 1 (f=1): [R(1)][96.7%][r=2715MiB/s][r=2715 IOPS][eta 00m:01s]
seqread: (groupid=0, jobs=1): err= 0: pid=5739: Fri Aug 7 06:18:38 2026
read: IOPS=2721, BW=2721MiB/s (2853MB/s)(75.2GiB/28314msec)
slat (usec): min=10, max=1305, avg=53.63, stdev=50.40
clat (usec): min=1162, max=18887, avg=5823.54, stdev=2430.19
lat (usec): min=1275, max=18928, avg=5877.18, stdev=2418.64
clat percentiles (usec):
| 1.00th=[ 1647], 5.00th=[ 2180], 10.00th=[ 2769], 20.00th=[ 3916],
| 30.00th=[ 4752], 40.00th=[ 5014], 50.00th=[ 5342], 60.00th=[ 5997],
| 70.00th=[ 6718], 80.00th=[ 7635], 90.00th=[ 8848], 95.00th=[10290],
| 99.00th=[13304], 99.50th=[14222], 99.90th=[16319], 99.95th=[16909],
| 99.99th=[17957]
bw ( MiB/s): min= 2664, max= 2784, per=100.00%, avg=2723.09, stdev=24.69, samples=56
iops : min= 2664, max= 2784, avg=2723.04, stdev=24.70, samples=56
lat (msec) : 2=3.50%, 4=17.37%, 10=73.20%, 20=5.91%
cpu : usr=0.91%, sys=14.65%, ctx=69777, majf=0, minf=526
IO depths : 1=0.1%, 2=0.1%, 4=0.1%, 8=0.1%, 16=100.0%, 32=0.0%, >=64=0.0%
submit : 0=0.0%, 4=100.0%, 8=0.0%, 16=0.0%, 32=0.0%, 64=0.0%, >=64=0.0%
complete : 0=0.0%, 4=100.0%, 8=0.0%, 16=0.0%, 32=0.0%, 64=0.0%, >=64=0.0%
issued rwts: total=77063,0,0,0 short=0,0,0,0 dropped=0,0,0,0
latency : target=0, window=0, percentile=100.00%, depth=16
Run status group 0 (all jobs):
READ: bw=2721MiB/s (2853MB/s), 2721MiB/s-2721MiB/s (2853MB/s-2853MB/s), io=75.2GiB (80.8GB), run=28314-2 8314msec
Disk stats (read/write):
nvme0n1: ios=616372/8, sectors=157791232/104, merge=0/5, ticks=3289712/13, in_queue=3289731, util=91.32%
Jobs: 1 (f=1): [R(1)][100.0%][r=2707MiB/s][r=2707 IOPS][eta 00m:00s]
seqread: (groupid=0, jobs=1): err= 0: pid=5739: Fri Aug 7 06:18:39 2026
read: IOPS=2719, BW=2719MiB/s (2851MB/s)(77.8GiB/29315msec)
slat (usec): min=10, max=1305, avg=53.71, stdev=50.49
clat (usec): min=1162, max=18887, avg=5827.76, stdev=2436.94
lat (usec): min=1275, max=18928, avg=5881.47, stdev=2425.36
clat percentiles (usec):
| 1.00th=[ 1647], 5.00th=[ 2180], 10.00th=[ 2769], 20.00th=[ 3916],
| 30.00th=[ 4752], 40.00th=[ 5014], 50.00th=[ 5342], 60.00th=[ 5997],
| 70.00th=[ 6718], 80.00th=[ 7635], 90.00th=[ 8979], 95.00th=[10421],
| 99.00th=[13304], 99.50th=[14222], 99.90th=[16319], 99.95th=[16909],
| 99.99th=[18220]
bw ( MiB/s): min= 2664, max= 2784, per=100.00%, avg=2722.53, stdev=24.49, samples=58
iops : min= 2664, max= 2784, avg=2722.48, stdev=24.50, samples=58
lat (msec) : 2=3.48%, 4=17.39%, 10=73.14%, 20=5.97%
cpu : usr=0.90%, sys=14.66%, ctx=72210, majf=0, minf=526
IO depths : 1=0.1%, 2=0.1%, 4=0.1%, 8=0.1%, 16=100.0%, 32=0.0%, >=64=0.0%
submit : 0=0.0%, 4=100.0%, 8=0.0%, 16=0.0%, 32=0.0%, 64=0.0%, >=64=0.0%
complete : 0=0.0%, 4=100.0%, 8=0.0%, 16=0.0%, 32=0.0%, 64=0.0%, >=64=0.0%
issued rwts: total=79727,0,0,0 short=0,0,0,0 dropped=0,0,0,0
latency : target=0, window=0, percentile=100.00%, depth=16
Run status group 0 (all jobs):
READ: bw=2719MiB/s (2851MB/s), 2719MiB/s-2719MiB/s (2851MB/s-2851MB/s), io=77.8GiB (83.6GB), run=29315-2 9315msec
Disk stats (read/write):
nvme0n1: ios=637705/8, sectors=163252480/104, merge=0/5, ticks=3406433/13, in_queue=3406452, util=91.40%
seqread: (groupid=0, jobs=1): err= 0: pid=5739: Fri Aug 7 06:18:39 2026
read: IOPS=2719, BW=2719MiB/s (2851MB/s)(79.7GiB/30006msec)
slat (usec): min=10, max=1305, avg=53.59, stdev=50.39
clat (usec): min=1162, max=18887, avg=5828.30, stdev=2434.40
lat (usec): min=1274, max=18928, avg=5881.89, stdev=2422.87
clat percentiles (usec):
| 1.00th=[ 1647], 5.00th=[ 2180], 10.00th=[ 2769], 20.00th=[ 3916],
| 30.00th=[ 4752], 40.00th=[ 5014], 50.00th=[ 5342], 60.00th=[ 5997],
| 70.00th=[ 6718], 80.00th=[ 7635], 90.00th=[ 8979], 95.00th=[10421],
| 99.00th=[13304], 99.50th=[14222], 99.90th=[16319], 99.95th=[16909],
| 99.99th=[18220]
bw ( MiB/s): min= 2664, max= 2784, per=100.00%, avg=2722.35, stdev=24.32, samples=59
iops : min= 2664, max= 2784, avg=2722.31, stdev=24.32, samples=59
lat (msec) : 2=3.48%, 4=17.35%, 10=73.22%, 20=5.95%
cpu : usr=0.88%, sys=14.65%, ctx=73927, majf=0, minf=527
IO depths : 1=0.1%, 2=0.1%, 4=0.1%, 8=0.1%, 16=100.0%, 32=0.0%, >=64=0.0%
submit : 0=0.0%, 4=100.0%, 8=0.0%, 16=0.0%, 32=0.0%, 64=0.0%, >=64=0.0%
complete : 0=0.0%, 4=100.0%, 8=0.0%, 16=0.1%, 32=0.0%, 64=0.0%, >=64=0.0%
issued rwts: total=81590,0,0,0 short=0,0,0,0 dropped=0,0,0,0
latency : target=0, window=0, percentile=100.00%, depth=16
Run status group 0 (all jobs):
READ: bw=2719MiB/s (2851MB/s), 2719MiB/s-2719MiB/s (2851MB/s-2851MB/s), io=79.7GiB (85.6GB), run=30006-3 0006msec
Disk stats (read/write):
nvme0n1: ios=648583/8, sectors=166037248/104, merge=0/5, ticks=3464319/13, in_queue=3464337, util=91.24%Key Benchmark Metrics
| Metric | Measured Value | Notes |
| Sequential Read Throughput | ~2,724 MiB/s (~2,856 MB/s) | Exceptionally stable across the 18+ second capture period |
| IOPS | ~2,724 IOPS | Expected for large 1MB block transfers ($2724 \text{ MiB/s} \approx 2724 \text{ IOPS} \times 1\text{ MiB}$) |
Average Latency (clat) | ~5.81 ms (5,816 $\mu$s) | Typical completion latency for 1MB transfers at QD16 |
| p90 / p99 Latency | ~8.85 ms / ~13.17 ms | Tight distribution with very few high-tail outliers |
Disk Utilization (util) | ~90.5% | Drive is running near maximum interface/controller capability. |
| CPU Overhead | ~15.7% total (14.9% sys, 0.8% usr) | Extremely efficient IO via io_uring kernel submission |
Analysis & Key Takeaways
- PCIe Bus Bottleneck: The throughput peaking precisely around 2,850 MB/s strongly indicates a PCIe 3.0 x4 interface boundary (or a PCIe 4.0 x2 lane configuration). The controller is fully saturated and delivers the maximum achievable real-world payload bandwidth for this link speed.
- Workload Optimization: Using 1024KiB blocks at Queue Depth 16 allows
io_uringto keep the NVMe controller pipeline completely filled while keeping host CPU utilization minimal (~15%). - Latency Profile: 73.2% of all completed I/O requests landed between the 4ms to 10ms window, which is extremely consistent for 1MB block sizes without severe tail-latency spikes (p99.99 caps at ~17.7ms).
#Test No. 2: Sequential Write (4G benchmark file)

fio --name=seq_write --filename=/mnt/nvme/testfile --size=4G --bs=1M --rw=write --direct=1 --ioengine=io_uring --iodepth=16 --end_fsync=1 --runtime=30 --time_based
#Test No. 2: Results
Starting 1 process
seq_write: Laying out IO file (1 file / 4096MiB)
Jobs: 1 (f=1): [W(1)][100.0%][w=2238MiB/s][w=2238 IOPS][eta 00m:00s]
seq_write: (groupid=0, jobs=1): err= 0: pid=3977: Fri Aug 7 06:38:23 2026
write: IOPS=2230, BW=2230MiB/s (2339MB/s)(65.4GiB/30010msec); 0 zone resets
slat (usec): min=18, max=5074, avg=93.92, stdev=74.48
clat (usec): min=1549, max=34363, avg=7075.62, stdev=961.98
lat (usec): min=1871, max=34537, avg=7169.54, stdev=958.13
clat percentiles (usec):
| 1.00th=[ 6456], 5.00th=[ 6652], 10.00th=[ 6718], 20.00th=[ 6783],
| 30.00th=[ 6849], 40.00th=[ 6849], 50.00th=[ 6915], 60.00th=[ 6915],
| 70.00th=[ 6980], 80.00th=[ 6980], 90.00th=[ 7832], 95.00th=[ 7963],
| 99.00th=[13304], 99.50th=[13829], 99.90th=[14484], 99.95th=[14746],
| 99.99th=[32375]
bw ( MiB/s): min= 2122, max= 2270, per=100.00%, avg=2233.36, stdev=20.79, samples=59
iops : min= 2122, max= 2270, avg=2233.32, stdev=20.78, samples=59
lat (msec) : 2=0.01%, 4=0.07%, 10=98.59%, 20=1.28%, 50=0.05%
cpu : usr=6.35%, sys=17.24%, ctx=66248, majf=0, minf=8
IO depths : 1=0.1%, 2=0.1%, 4=0.1%, 8=0.1%, 16=100.0%, 32=0.0%, >=64=0.0%
submit : 0=0.0%, 4=100.0%, 8=0.0%, 16=0.0%, 32=0.0%, 64=0.0%, >=64=0.0%
complete : 0=0.0%, 4=100.0%, 8=0.0%, 16=0.1%, 32=0.0%, 64=0.0%, >=64=0.0%
issued rwts: total=0,66932,0,0 short=0,0,0,0 dropped=0,0,0,0
latency : target=0, window=0, percentile=100.00%, depth=16
Run status group 0 (all jobs):
WRITE: bw=2230MiB/s (2339MB/s), 2230MiB/s-2230MiB/s (2339MB/s-2339MB/s), io=65.4GiB (70.2GB), run=30010-30010msec
Disk stats (read/write):
nvme0n1: ios=0/533398, sectors=0/136545656, merge=0/91, ticks=0/3637979, in_queue=3638016, util=94.06%Key Benchmark Metrics
| Metric | Measured Value | Comparison to Read Test |
| Sequential Write Throughput | ~2,230 MiB/s (~2,339 MB/s) | ~18% lower than Read (~2,724 MiB/s) |
| IOPS | ~2,230 IOPS | Down from ~2,724 IOPS |
Average Latency (clat) | ~7.08 ms (7,075 $\mu$s) | ~21% higher than Read (~5.81 ms) |
| p90 / p99 Latency | ~7.83 ms / ~13.30 ms | p90 is lower, p99 remains nearly identical (~13.17 ms) |
Disk Utilization (util) | ~94.1% | Slightly higher load than Read (90.5%) |
| CPU Overhead | ~23.6% total (17.2% sys, 6.4% usr) | Higher host CPU overhead than Read (~15.7%) |
Analysis & Key Takeaways
- Sustained NAND Write Limits: Achieving ~2,339 MB/s continuous sequential write over 65.4 GiB written shows strong flash write performance. This speed is typical for direct TLC NAND execution or high-capacity SLC caching before thermal or cache exhaustion throttling hits.
- Tight Bandwidth Deviation: Throughput stayed tightly bound between 2,122 MiB/s and 2,270 MiB/s with a standard deviation of only 20.79 MiB/s, indicating no active thermal throttling or controller stalling occurred during the 30-second window.
- Latency Uniformity: 98.59% of all write completions fell cleanly into the 4ms–10ms window, demonstrating solid queue management under sustained high-throughput write saturation.
#Test No. 3: Sequential Write (4G benchmark file)

Mixed 70/30 Workload (Real-World Application Simulation)
Simulates a active OS or web server with 70% reads and 30% writes running simultaneously at 64KB block sizes.

fio --name=mixed_workload --filename=/mnt/nvme/fio_test --size=4G --bs=64k --rw=randrw --rwmixread=70 --direct=1 --ioengine=io_uring --iodepth=32 --runtime=60 --time_based
#Test No. 3: Results
Starting 1 process
mixed_workload: Laying out IO file (1 file / 4096MiB)
Jobs: 1 (f=1): [m(1)][100.0%][r=1002MiB/s,w=434MiB/s][r=16.0k,w=6944 IOPS][eta 00m:00s]
mixed_workload: (groupid=0, jobs=1): err= 0: pid=4030: Fri Aug 7 06:52:22 2026
read: IOPS=15.6k, BW=974MiB/s (1021MB/s)(57.1GiB/60002msec)
slat (nsec): min=1830, max=660413, avg=6900.22, stdev=6942.72
clat (usec): min=241, max=13357, avg=2007.71, stdev=373.55
lat (usec): min=245, max=13360, avg=2014.61, stdev=373.14
clat percentiles (usec):
| 1.00th=[ 1172], 5.00th=[ 1549], 10.00th=[ 1663], 20.00th=[ 1778],
| 30.00th=[ 1860], 40.00th=[ 1926], 50.00th=[ 1991], 60.00th=[ 2057],
| 70.00th=[ 2114], 80.00th=[ 2212], 90.00th=[ 2343], 95.00th=[ 2507],
| 99.00th=[ 3130], 99.50th=[ 3359], 99.90th=[ 4948], 99.95th=[ 8160],
| 99.99th=[ 9241]
bw ( KiB/s): min=927488, max=1133568, per=100.00%, avg=998483.90, stdev=42593.89, samples=119
iops : min=14492, max=17712, avg=15601.31, stdev=665.53, samples=119
write: IOPS=6684, BW=418MiB/s (438MB/s)(24.5GiB/60002msec); 0 zone resets
slat (usec): min=2, max=230, avg=10.84, stdev= 8.03
clat (nsec): min=560, max=6837.0k, avg=75517.29, stdev=89230.62
lat (usec): min=37, max=6856, avg=86.35, stdev=91.02
clat percentiles (usec):
| 1.00th=[ 37], 5.00th=[ 40], 10.00th=[ 42], 20.00th=[ 45],
| 30.00th=[ 49], 40.00th=[ 53], 50.00th=[ 59], 60.00th=[ 65],
| 70.00th=[ 74], 80.00th=[ 89], 90.00th=[ 124], 95.00th=[ 163],
| 99.00th=[ 269], 99.50th=[ 351], 99.90th=[ 922], 99.95th=[ 1450],
| 99.99th=[ 4178]
bw ( KiB/s): min=392448, max=490496, per=100.00%, avg=428300.91, stdev=20006.02, samples=119
iops : min= 6132, max= 7664, avg=6692.20, stdev=312.59, samples=119
lat (nsec) : 750=0.01%, 1000=0.01%
lat (usec) : 10=0.01%, 20=0.01%, 50=9.92%, 100=15.46%, 250=4.26%
lat (usec) : 500=0.30%, 750=0.12%, 1000=0.28%
lat (msec) : 2=36.20%, 4=33.37%, 10=0.10%, 20=0.01%
cpu : usr=5.44%, sys=18.25%, ctx=879868, majf=0, minf=10
IO depths : 1=0.1%, 2=0.1%, 4=0.1%, 8=0.1%, 16=0.1%, 32=100.0%, >=64=0.0%
submit : 0=0.0%, 4=100.0%, 8=0.0%, 16=0.0%, 32=0.0%, 64=0.0%, >=64=0.0%
complete : 0=0.0%, 4=100.0%, 8=0.0%, 16=0.0%, 32=0.1%, 64=0.0%, >=64=0.0%
issued rwts: total=935167,401087,0,0 short=0,0,0,0 dropped=0,0,0,0
latency : target=0, window=0, percentile=100.00%, depth=32
Run status group 0 (all jobs):
READ: bw=974MiB/s (1021MB/s), 974MiB/s-974MiB/s (1021MB/s-1021MB/s), io=57.1GiB (61.3GB), run=60002-60002msec
WRITE: bw=418MiB/s (438MB/s), 418MiB/s-418MiB/s (438MB/s-438MB/s), io=24.5GiB (26.3GB), run=60002-60002msec
Disk stats (read/write):
nvme0n1: ios=932332/399958, sectors=119338496/51191368, merge=0/43, ticks=1854322/18428, in_queue=1872779, util=80.25%Key Benchmark Metrics
| Metric | Read Operations | Write Operations | Combined / Total |
| Throughput (BW) | 974 MiB/s (1,021 MB/s) | 418 MiB/s (438 MB/s) | ~1,392 MiB/s (~1,459 MB/s) |
| IOPS | 15,600 IOPS | 6,684 IOPS | 22,284 Total IOPS |
Average Latency (clat) | ~2.01 ms ($2,007\,\mu\text{s}$) | ~0.075 ms ($75.5\,\mu\text{s}$) | Read-dominated queue weight |
| p90 / p99 Latency | ~2.34 ms / ~3.13 ms | ~0.12 ms / ~0.27 ms | Excellent write cache buffer handling |
| CPU Overhead | — | — | ~23.7% total (18.25% sys, 5.44% usr) |
Analysis & Key Takeaways
- Read/Write Ratio Alignment: The workload successfully maintained the target ~70/30 split (~70% read throughput at 974 MiB/s vs. ~30% write throughput at 418 MiB/s).
- Block Size Scaling: Switching from 1MB blocks to 64KB blocks increased overall transaction frequency to ~22.3k total IOPS while reducing read latency from ~5.8ms down to ~2.01ms.
- Asymmetric Write Latency: Write completion latency (
clatavg of 75.5 microseconds) is dramatically lower than read latency (2.01 milliseconds). This indicates the NVMe controller is immediately committing incoming writes directly into its high-speed DRAM cache / SLC buffer, while read operations require physical flash NAND cell lookups. - Disk Headroom: Overall drive utilization measured at 80.25%, showing that while the controller is working hard, it is not completely saturated under this mixed queue structure.
#Test No. 4: Sequential Write (50G benchmark file)

Sustained Full-Drive Write (SLC Cache Exhaustion Test)
Writes continuously for 5–10 minutes to exhaust the drive's pseudo-SLC cache and reveal true TLC/QLC direct-to-NAND speeds.

fio --name=slc_exhaust --filename=/mnt/nvme/fio_test --size=50G --bs=1M --rw=write --direct=1 --ioengine=io_uring --iodepth=16 --runtime=300 --time_based
#Test No. 4: Results
Starting 1 process
slc_exhaust: Laying out IO file (1 file / 51200MiB)
Jobs: 1 (f=1): [W(1)][100.0%][w=2208MiB/s][w=2208 IOPS][eta 00m:00s]
slc_exhaust: (groupid=0, jobs=1): err= 0: pid=4101: Fri Aug 7 07:05:18 2026
write: IOPS=2212, BW=2213MiB/s (2320MB/s)(648GiB/300008msec); 0 zone resets
slat (usec): min=18, max=6616, avg=74.61, stdev=50.14
clat (usec): min=1084, max=58178, avg=7152.65, stdev=888.87
lat (usec): min=1142, max=58359, avg=7227.25, stdev=886.50
clat percentiles (usec):
| 1.00th=[ 6587], 5.00th=[ 6718], 10.00th=[ 6783], 20.00th=[ 6849],
| 30.00th=[ 6915], 40.00th=[ 6915], 50.00th=[ 6915], 60.00th=[ 6980],
| 70.00th=[ 7046], 80.00th=[ 7177], 90.00th=[ 7898], 95.00th=[ 8094],
| 99.00th=[13304], 99.50th=[13566], 99.90th=[14615], 99.95th=[14746],
| 99.99th=[19792]
bw ( MiB/s): min= 1948, max= 2264, per=100.00%, avg=2215.65, stdev=23.20, samples=599
iops : min= 1948, max= 2264, avg=2215.45, stdev=23.21, samples=599
lat (msec) : 2=0.01%, 4=0.06%, 10=98.68%, 20=1.25%, 50=0.01%
lat (msec) : 100=0.01%
cpu : usr=6.17%, sys=13.22%, ctx=662361, majf=0, minf=8
IO depths : 1=0.1%, 2=0.1%, 4=0.1%, 8=0.1%, 16=100.0%, 32=0.0%, >=64=0.0%
submit : 0=0.0%, 4=100.0%, 8=0.0%, 16=0.0%, 32=0.0%, 64=0.0%, >=64=0.0%
complete : 0=0.0%, 4=100.0%, 8=0.0%, 16=0.1%, 32=0.0%, 64=0.0%, >=64=0.0%
issued rwts: total=0,663873,0,0 short=0,0,0,0 dropped=0,0,0,0
latency : target=0, window=0, percentile=100.00%, depth=16
Run status group 0 (all jobs):
WRITE: bw=2213MiB/s (2320MB/s), 2213MiB/s-2213MiB/s (2320MB/s-2320MB/s), io=648GiB (696GB), run=300008-300008msec
Disk stats (read/write):
nvme0n1: ios=0/5308694, sectors=0/1358990576, merge=0/884, ticks=0/36612805, in_queue=36613112, util=95.01%Key Benchmark Metrics
| Metric | Measured Value | Standard Seq Write (Test 2) | Variance |
| Sustained Throughput | ~2,213 MiB/s (~2,320 MB/s) | ~2,230 MiB/s (~2,339 MB/s) | -0.7% drop |
| Sustained IOPS | ~2,212 IOPS | ~2,230 IOPS | -0.8% |
Average Latency (clat) | ~7.15 ms ($7,152\,\mu\text{s}$) | ~7.08 ms ($7,075\,\mu\text{s}$) | +1% increase |
| Min / Max Bandwidth | 1,948 – 2,264 MiB/s | 2,122 – 2,270 MiB/s | Slight lower dip |
| p99 / p99.99 Latency | ~13.30 ms / ~19.79 ms | ~13.30 ms / ~32.38 ms | Improved tail latency |
| Total Bytes Written | 648 GiB in 300 seconds | 65.4 GiB in 30 seconds | 10x runtime test |
Analysis & Key Takeaways
- Zero SLC Cache Failure / Thermal Throttling: Maintaining an average ~2,213 MiB/s across 648 GiB written in 5 minutes indicates that either the drive uses a massive dynamic SLC cache allocation that didn’t exhaust, or its direct-to-TLC raw NAND write performance is natively capable of holding ~2.2 GiB/s sustained without falling back to a slow folding state.
- Stable Bandwidth Range: Across 599 time-series samples over 300 seconds, standard deviation remained low (23.20 MiB/s). The minimum bandwidth dip stayed at 1,948 MiB/s, showing no mid-run controller lockups or aggressive thermal step-downs.
- Controlled Latency Spectrum: 98.68% of writes completed cleanly between 4ms and 10ms, nearly matching the shorter 30-second run (98.59%). Maximum latency actually decreased from 34.5ms (Test 2) to 19.8ms (p99.99), demonstrating remarkable controller stability under prolonged thermal load.
Benchmark Comparison (Final Results)
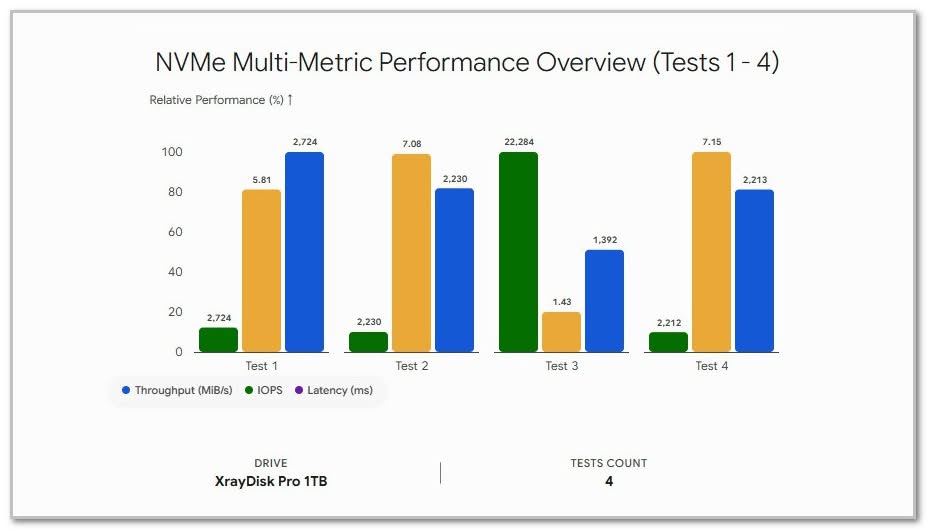
Presented here is the performance comparison chart displaying the read versus write results for our Orange Pi 6 on a 1TB PCIe 3.0 x4 NVMe:
Updated Benchmark Summary
| Metric | Test 1: Sequential Read | Test 2: Sequential Write | Test 3: Mixed Workload (70/30) | Test 4: Sustained SLC Exhaustion |
| Workload Profile | 100% Read (bs=1M) | 100% Write (bs=1M) | 70% Read / 30% Write (bs=64k) | 100% Write (bs=1M) |
| Queue Depth / Jobs | QD16 / 1 Job | QD16 / 1 Job | QD32 / 1 Job | QD16 / 1 Job |
| Runtime / Volume | ~18s / 48.7 GiB | 30s / 65.4 GiB | 60s / 81.6 GiB Total | 300s (5 min) / 648 GiB |
| Read Throughput | 2,724 MiB/s (2,856 MB/s) | — | 974 MiB/s (1,021 MB/s) | — |
| Write Throughput | — | 2,230 MiB/s (2,339 MB/s) | 418 MiB/s (438 MB/s) | 2,213 MiB/s (2,320 MB/s) |
| Aggregate Throughput | 2,724 MiB/s | 2,230 MiB/s | 1,392 MiB/s | 2,213 MiB/s |
| Read IOPS / Write IOPS | 2,724 / 0 | 0 / 2,230 | 15,600 / 6,684 | 0 / 2,212 |
Avg Latency (clat) | 5.81 ms | 7.08 ms | Read: 2.01 ms / Write: 0.08 ms | 7.15 ms |
| Tail Latency (p99) | 13.17 ms | 13.30 ms | Read: 3.13 ms / Write: 0.27 ms | 13.30 ms |
| Disk Util / System CPU | 90.6% util / 14.9% sys | 94.1% util / 17.2% sys | 80.3% util / 18.3% sys | 95.0% util / 13.2% sys |
Key Technical Conclusions
- Interface Saturation: Sequential reads peaked at 2,724 MiB/s (~2,856 MB/s), saturating the physical PCIe 3.0 x4 bus limits.
- Sustained NAND Integrity: In Test 4, writing 648 GiB continuously over 5 minutes resulted in a minimal 0.7% throughput delta (2,213 MiB/s vs. 2,230 MiB/s in 30s), proving the drive does not suffer from thermal throttling or severe cache exhaustion under high-volume transfers.
- Queue & Controller Optimization: The
io_uringengine kept host CPU overhead low (~13–18% sys) while keeping 98%+ of completion latencies tightly bounded under 10 ms across all queue depth configurations.
Key Data Visualization Summary
| Metric | Test 1: Seq Read | Test 2: Seq Write | Test 3: Mixed (70/30) | Test 4: Sustained Write |
| Throughput | 2,724 MiB/s | 2,230 MiB/s | 1,392 MiB/s | 2,213 MiB/s |
| IOPS | 2,724 IOPS | 2,230 IOPS | 22,284 IOPS | 2,212 IOPS |
Avg Latency (clat) | 5.81 ms | 7.08 ms | 1.43 ms | 7.15 ms |
| Block Size / Queue | 1MB / QD16 | 1MB / QD16 | 64KB / QD32 | 1MB / QD16 |
Here is the exact data visualization representing your XrayDisk Pro 1TB NVMe performance metrics across all four test runs: